Back
Analytics & BI Dashboards
Turning Transaction History Into Forward-Looking Customer Intelligence
A unified analytics platform that scores every customer's lifecycle stage, churn risk, lifetime value, and next likely purchase from a single consolidated data layer.
August 21, 2026
Share
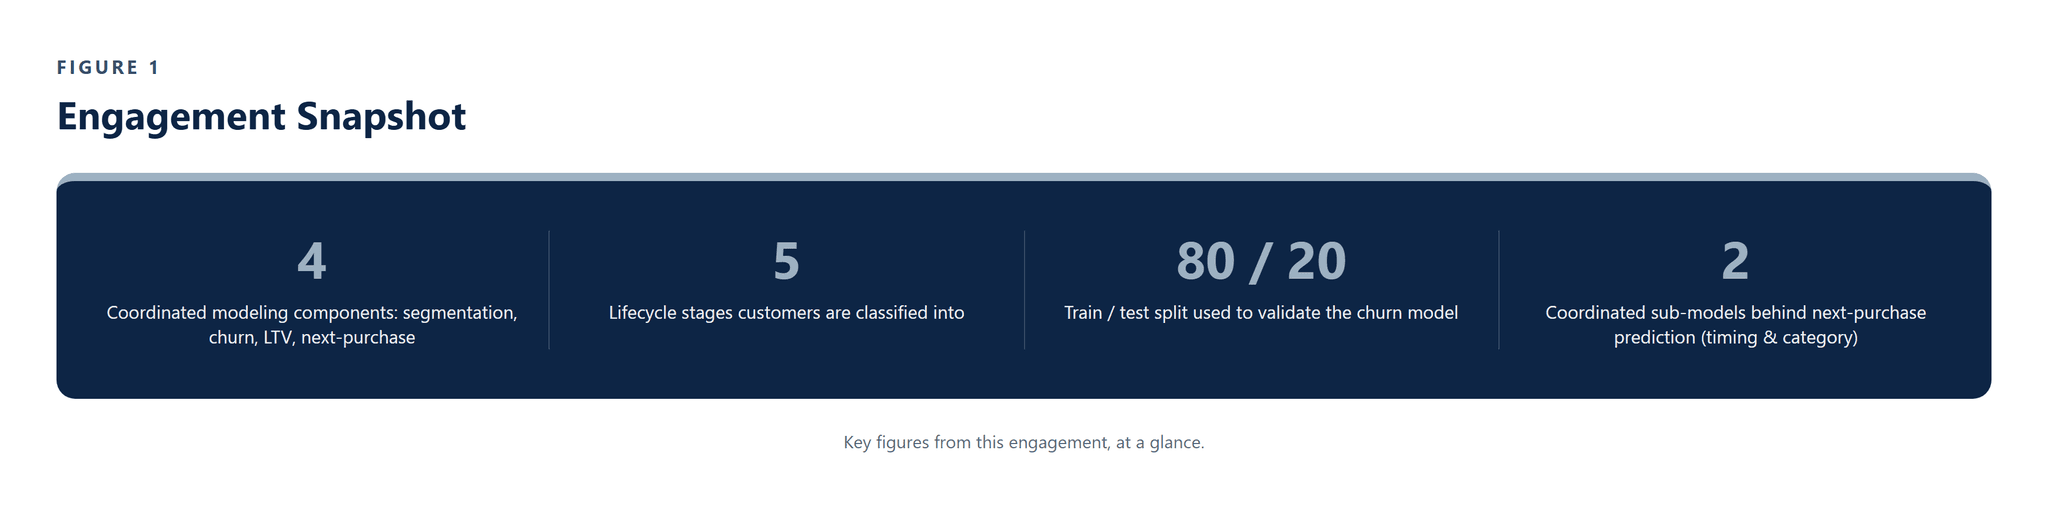
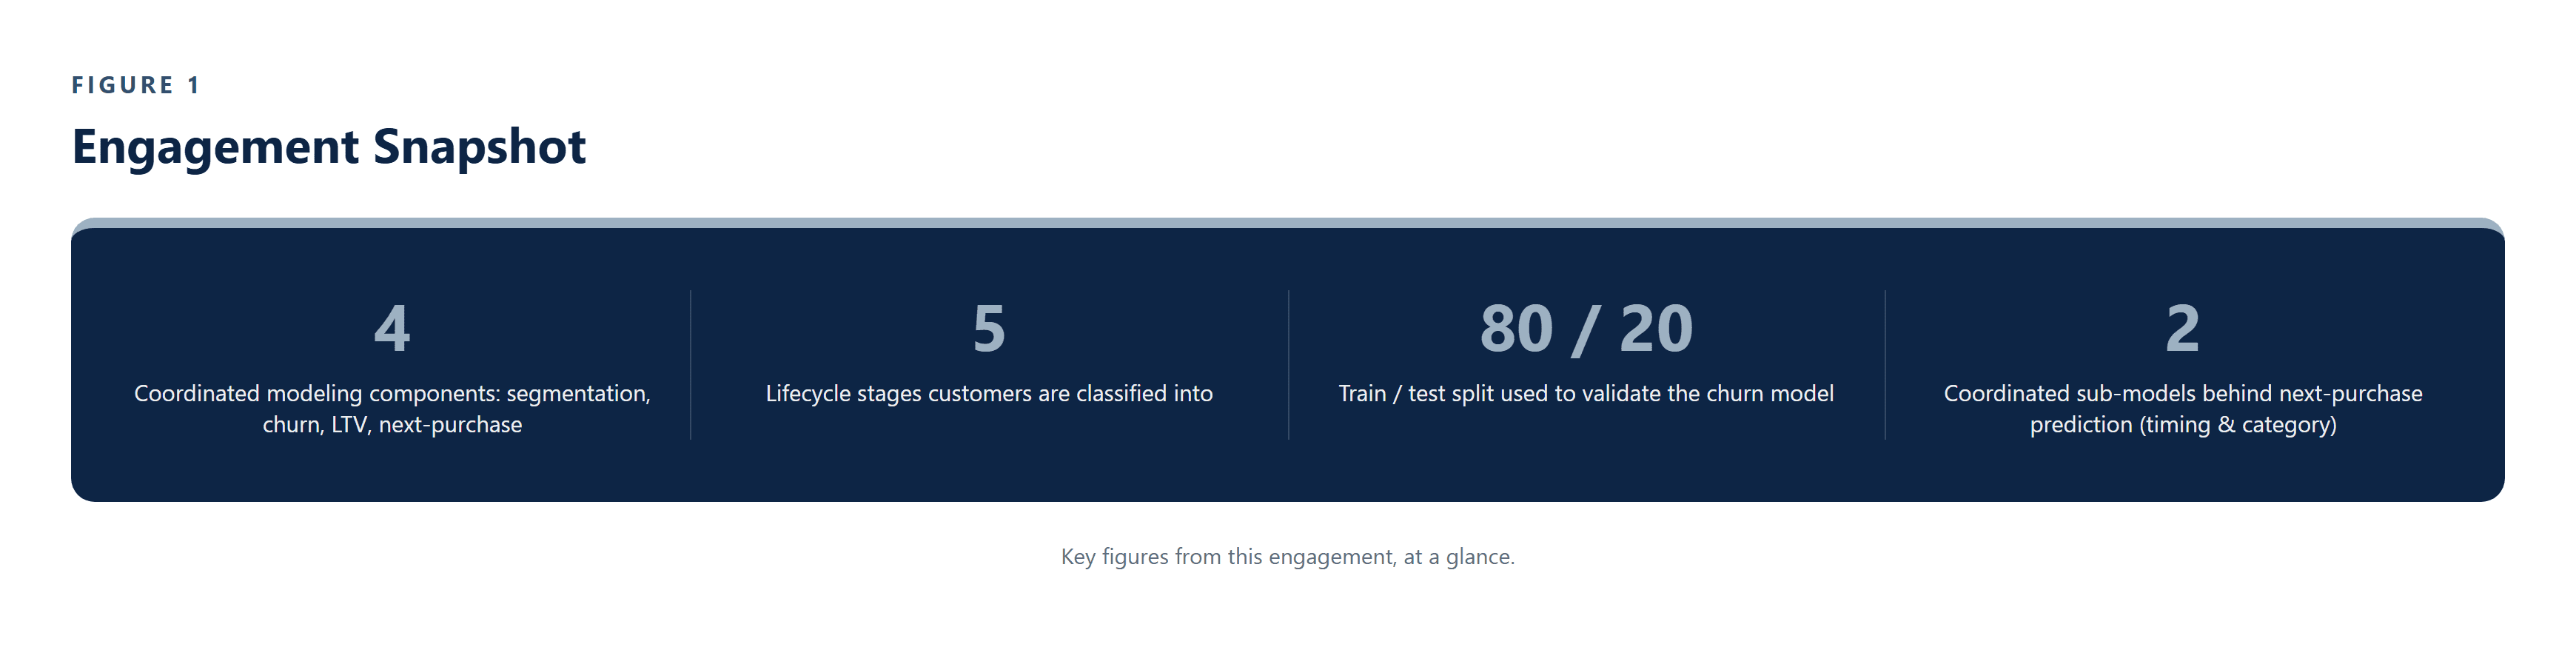
ENGAGEMENT SNAPSHOT

Figure 1 - Key figures from this engagement, at a glance.
EXECUTIVE SUMMARY
Our client's teams could see what customers had already done - past orders, past campaigns, past visits - but had no consistent way to see what a customer was likely to do next. Retention and marketing decisions were made on historical reporting alone, with no shared signal for who was at risk of leaving or who was worth the effort to keep.
Pfactorial Technologies built the Customer Analytics Platform to close that gap: a system that consolidates CRM, ERP, and point-of-sale data into a single customer-level analytics table, then runs four coordinated modeling components on top of it - lifecycle segmentation, churn prediction, lifetime value estimation, and next-purchase forecasting.
Rather than leaving churn risk and future value as two separate numbers for someone to reconcile by eye, the platform combines them into a single Expected Business Value score, so retention effort can be pointed directly at the customers who are both valuable and genuinely at risk of leaving - not just the loudest segment or the most recent complaint.
Why this engagement is representative This engagement demonstrates Pfactorial's approach to applied customer analytics: consolidating fragmented operational data into one analysis-ready layer, then combining several purpose-built models into a single prioritization score rather than shipping four disconnected dashboards.
THE CHALLENGE
Our client's teams were reporting on customer behavior after the fact, with no consistent way to act on it ahead of time. Four problems needed solving together.
1. Reporting looked backward, not forward
Existing tools could describe what customers had already done, but gave marketing, retention, and account teams no forward-looking signal for who was likely to disengage or how much a customer would be worth going forward.
2. Customer data was scattered across systems
CRM, ERP, and point-of-sale systems each held a partial view of the customer relationship, with no single, consolidated, customer-level table that every downstream model could read from consistently.
3. Risk and value were never combined
Churn likelihood and predicted future spend, where either existed at all, were separate numbers. Without a combined score, retention effort had no principled way to prioritize the customers who were both valuable and genuinely at risk.
4. Engagement data wasn't always available
Campaign and login data from the marketing stack was available for some clients and not others, so the models needed to produce useful output either way rather than depending on a data source that couldn't be guaranteed.
The real brief Not four separate models each running on their own, but one system that scores every customer's lifecycle stage, risk, and value together, so retention effort goes where it matters most.
THE SOLUTION
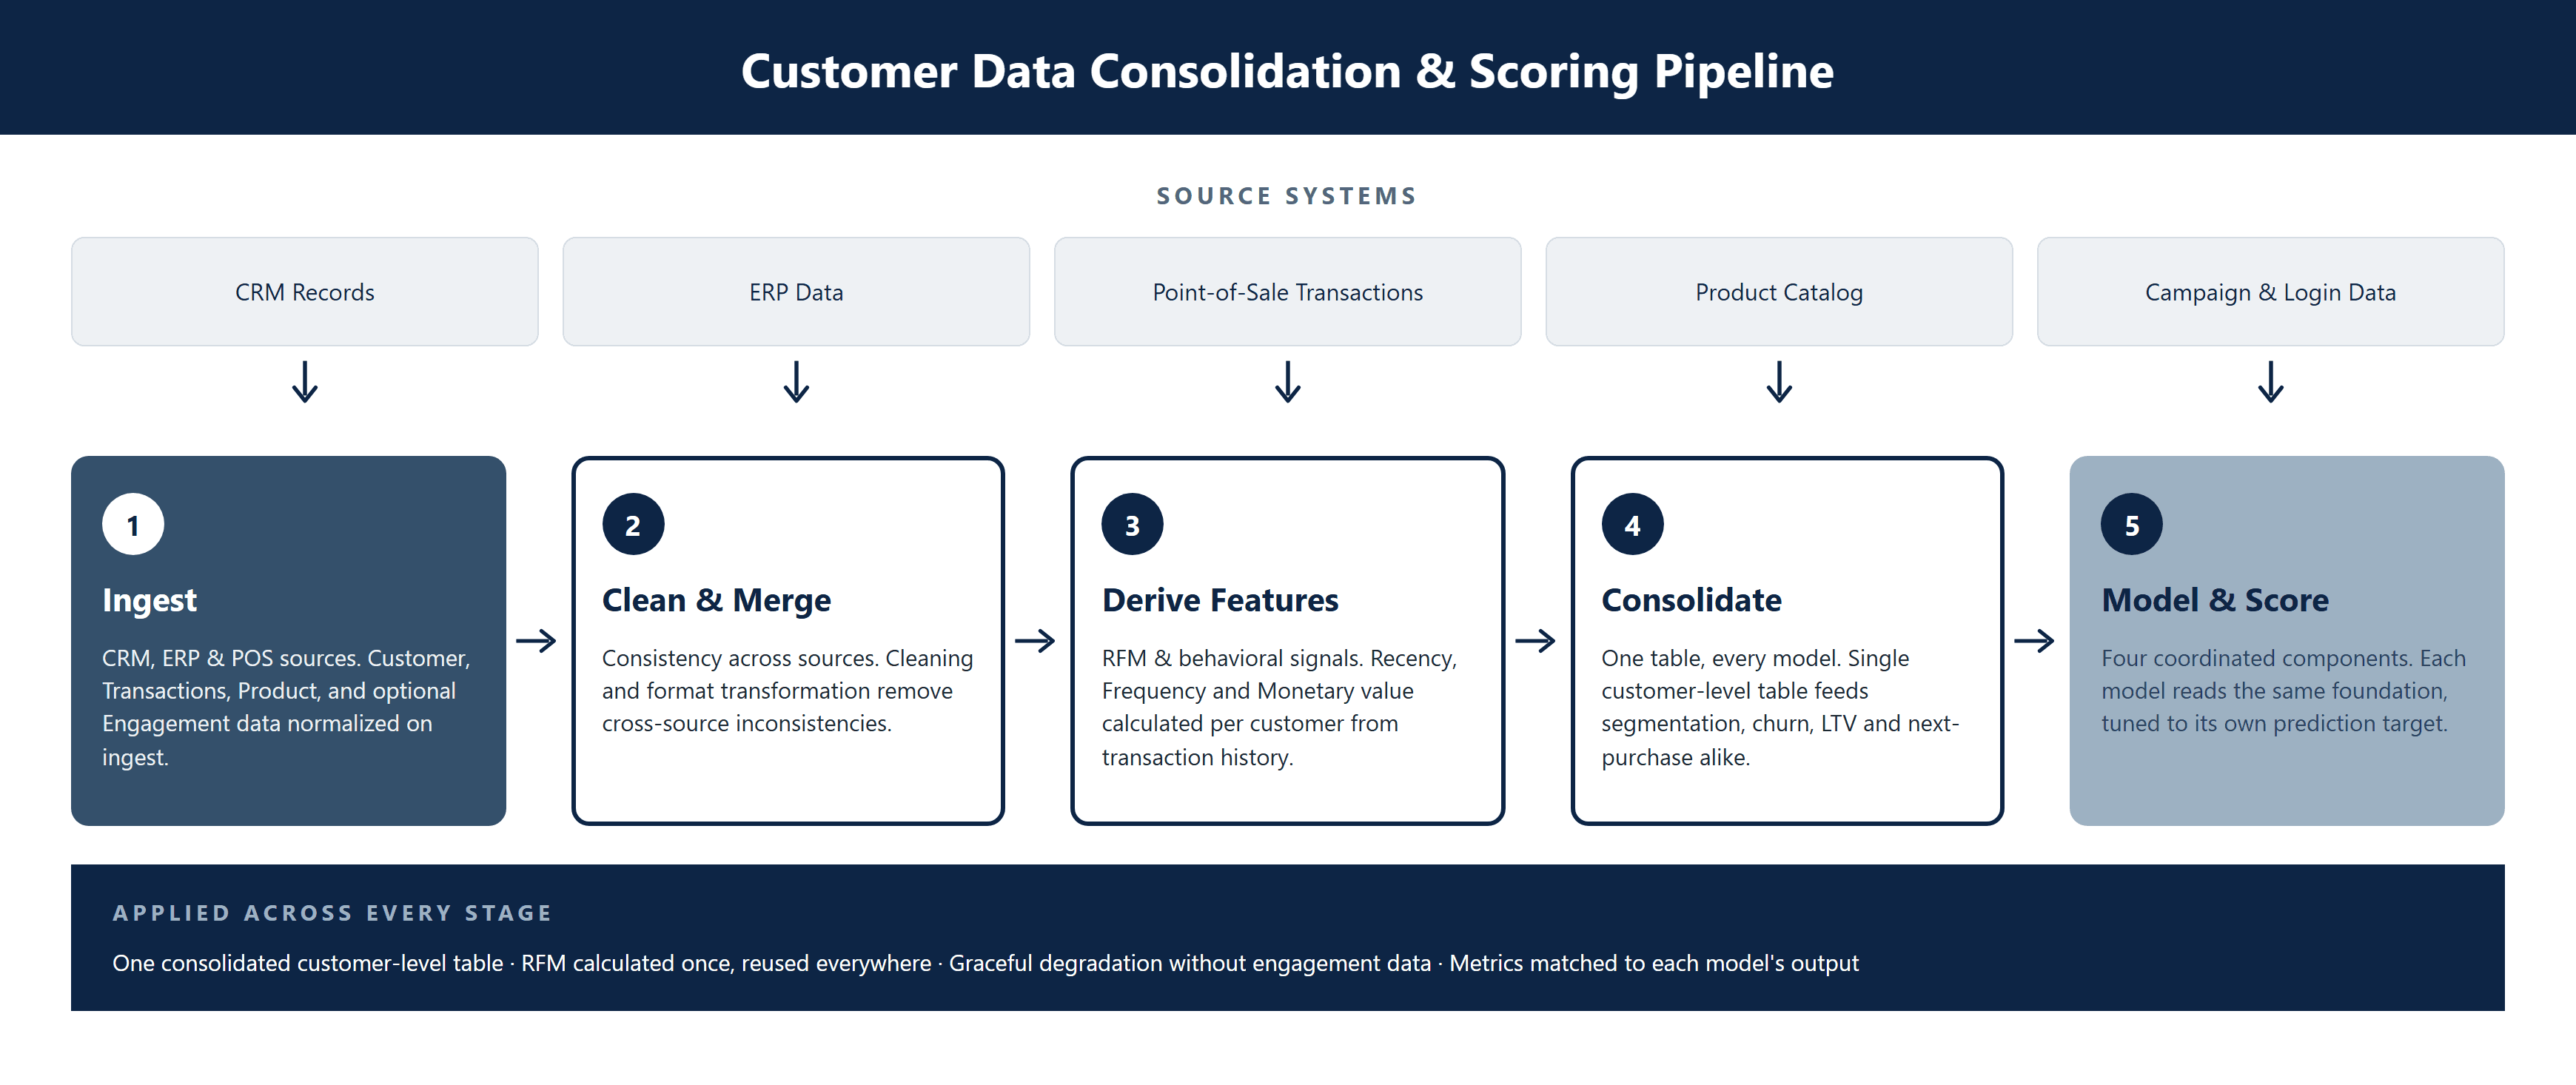
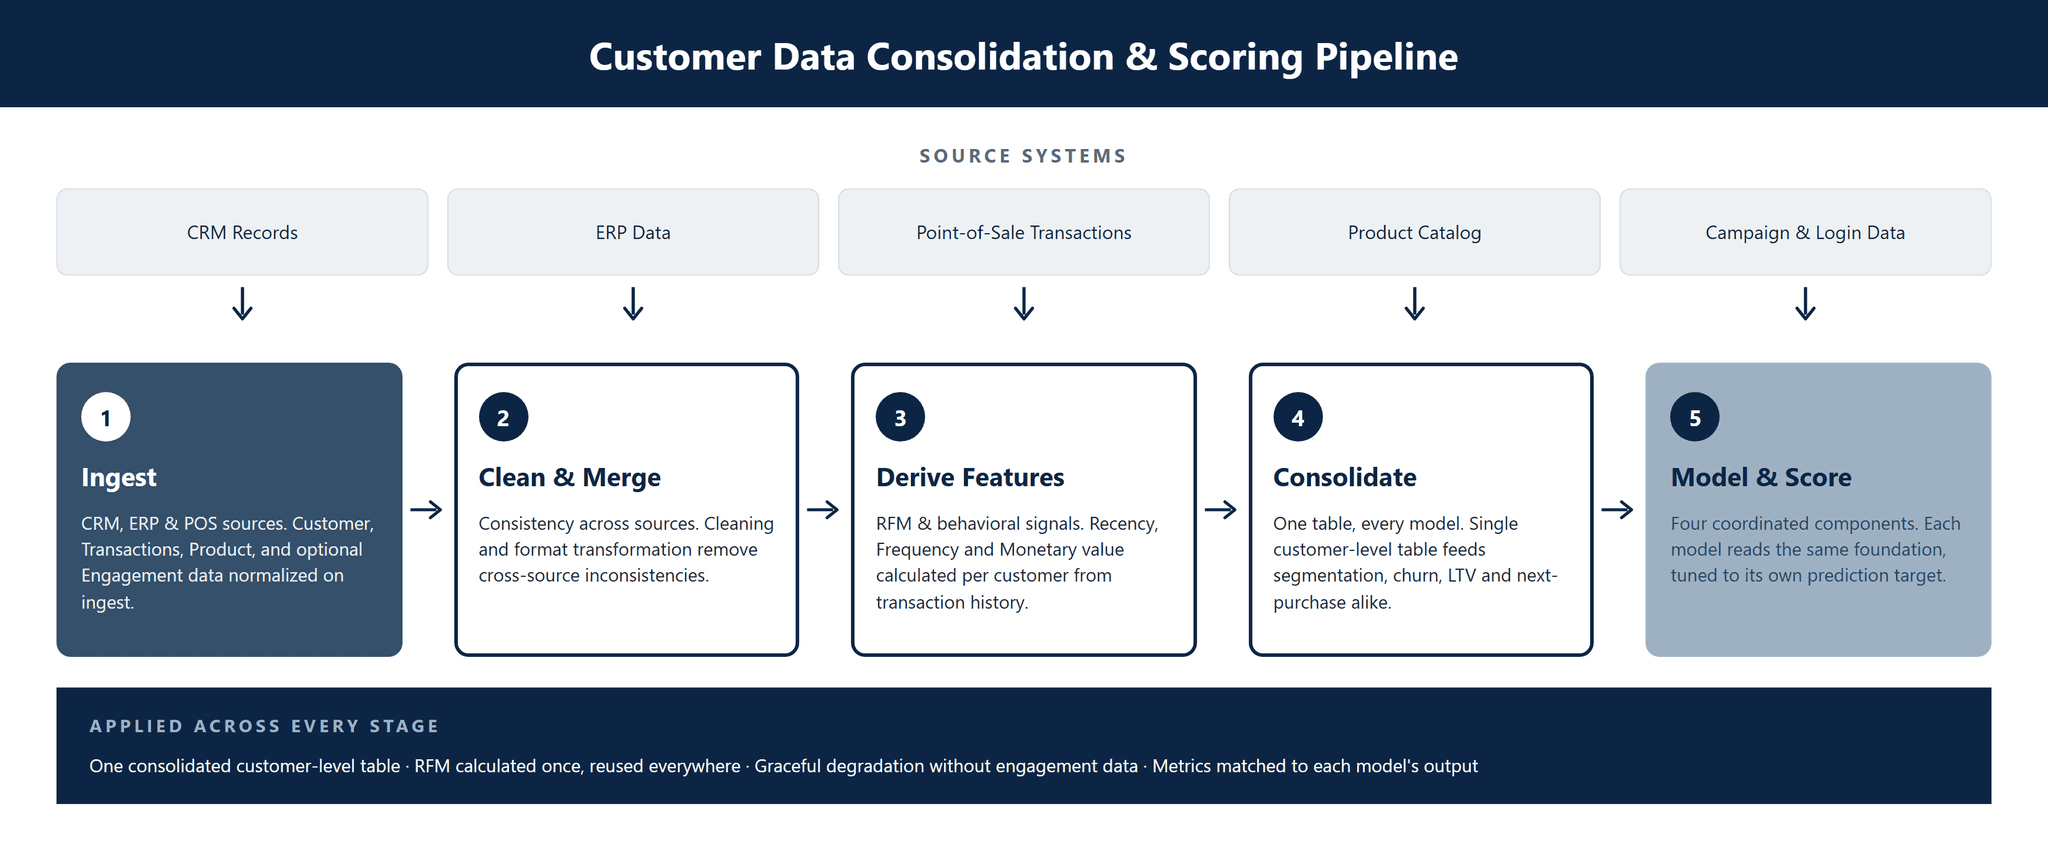
Pfactorial built the platform around a single consolidated analytics table, with every modeling component reading from that same foundation rather than reimplementing its own data preparation.

Figure 1 - Data pipeline: source consolidation, cleaning and RFM/behavioral feature derivation, and a single customer-level analytics table feeding every downstream model.
Architectural principles
- One consolidated table, every model reads from it - customer, transaction, product, and engagement data are cleaned, deduplicated, and merged into a single customer-level analytics table before any model runs, rather than each component pulling and preparing its own data independently.
- RFM as the shared foundation - Recency, Frequency, and Monetary value are calculated once per customer and normalized to a balanced 1-5 score, then reused as an input feature across segmentation, churn, and LTV rather than recalculated per model.
- The right algorithm per task, not one model for everything - classification models (RandomForest, XGBoost) handle churn; regression ensembles (XGBoost, LightGBM, CatBoost) with a Linear Regression baseline handle LTV; and next-purchase timing and category are each modeled with algorithms suited to their specific prediction type.
- Graceful degradation without engagement data - where campaign and login data isn't available from a client's marketing stack, the models fall back to transaction-only features rather than failing or requiring a data source that can't be guaranteed.
CAPABILITIES DELIVERED
The platform covers the full path from raw transaction history to a prioritized, business-facing view of every customer.
CAPABILITY | WHAT IT DOES |
|---|---|
Lifecycle Segmentation | Groups customers into New, Active, Loyal, At-Risk, and Churned stages using RFM profile and demographic clustering. |
Churn Prediction Engine | Scores every customer's probability of disengaging, scaled to a 0-100 Churn Risk Score with a configurable High Risk threshold. |
Lifetime Value Modeling | Forecasts each customer's expected future spend over a defined horizon using a rolling-window regression approach. |
Expected Business Value Scoring | Combines churn probability and predicted LTV into a single score that prioritizes customers who are both high-value and likely to stay. |
Next-Purchase Prediction | Two coordinated sub-models forecast purchase timing and the most probable product category for each customer's next order. |
Business-Facing Dashboard | Surfaces segments, churn risk, LTV, EBV, and next-purchase forecasts in Power BI or Tableau for marketing, retention, and account teams. |
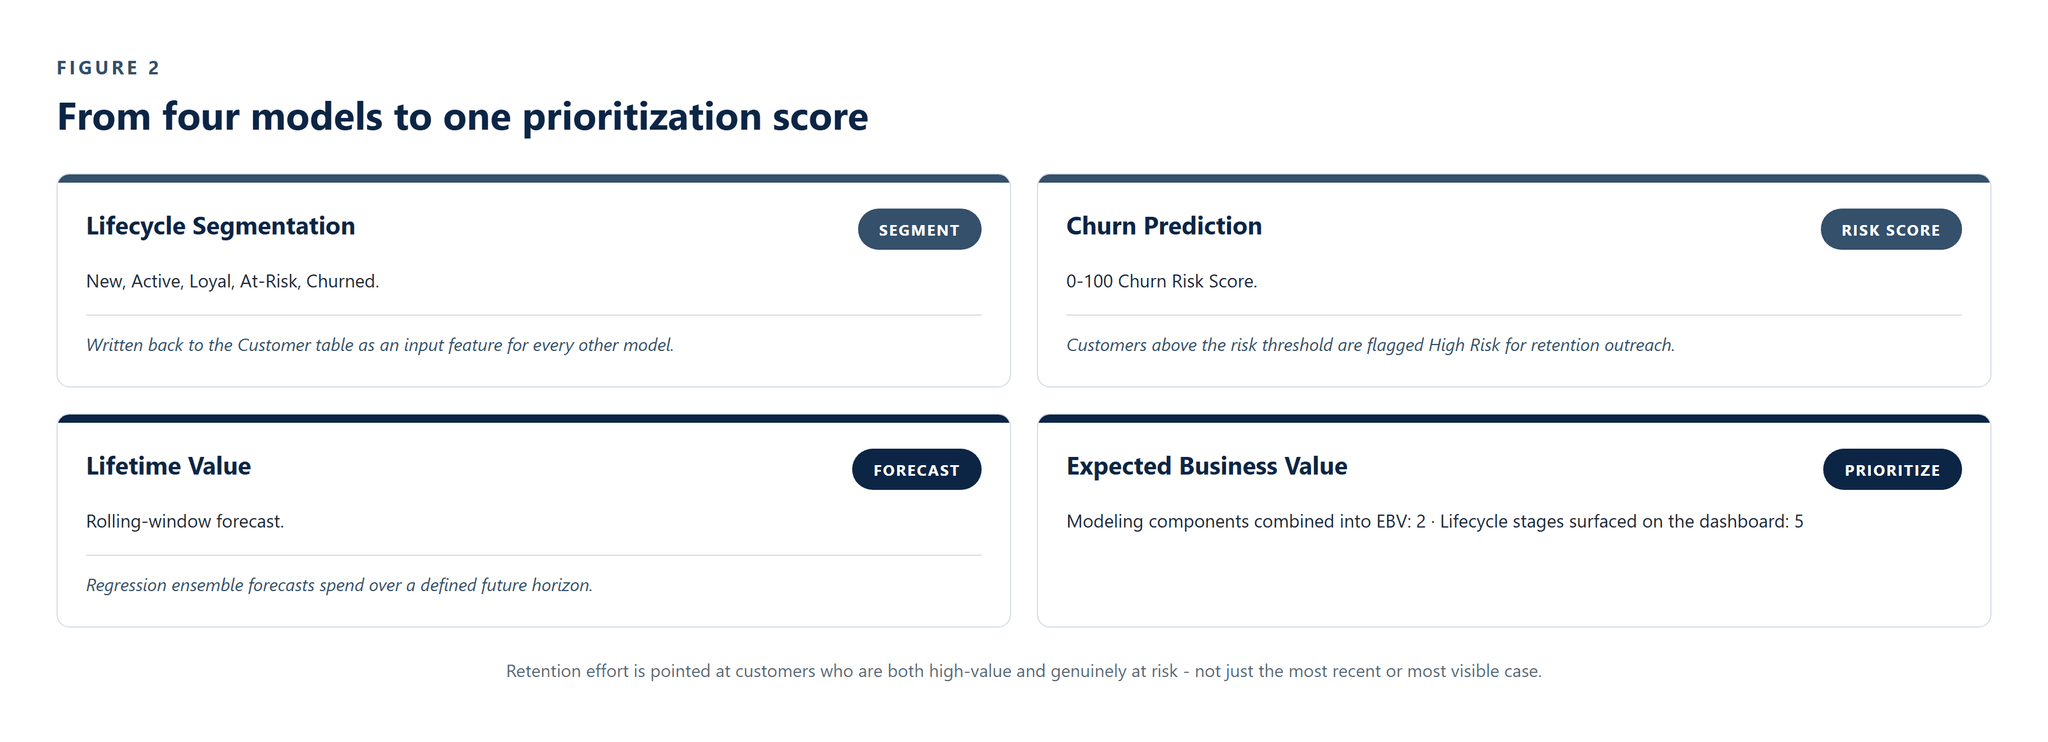
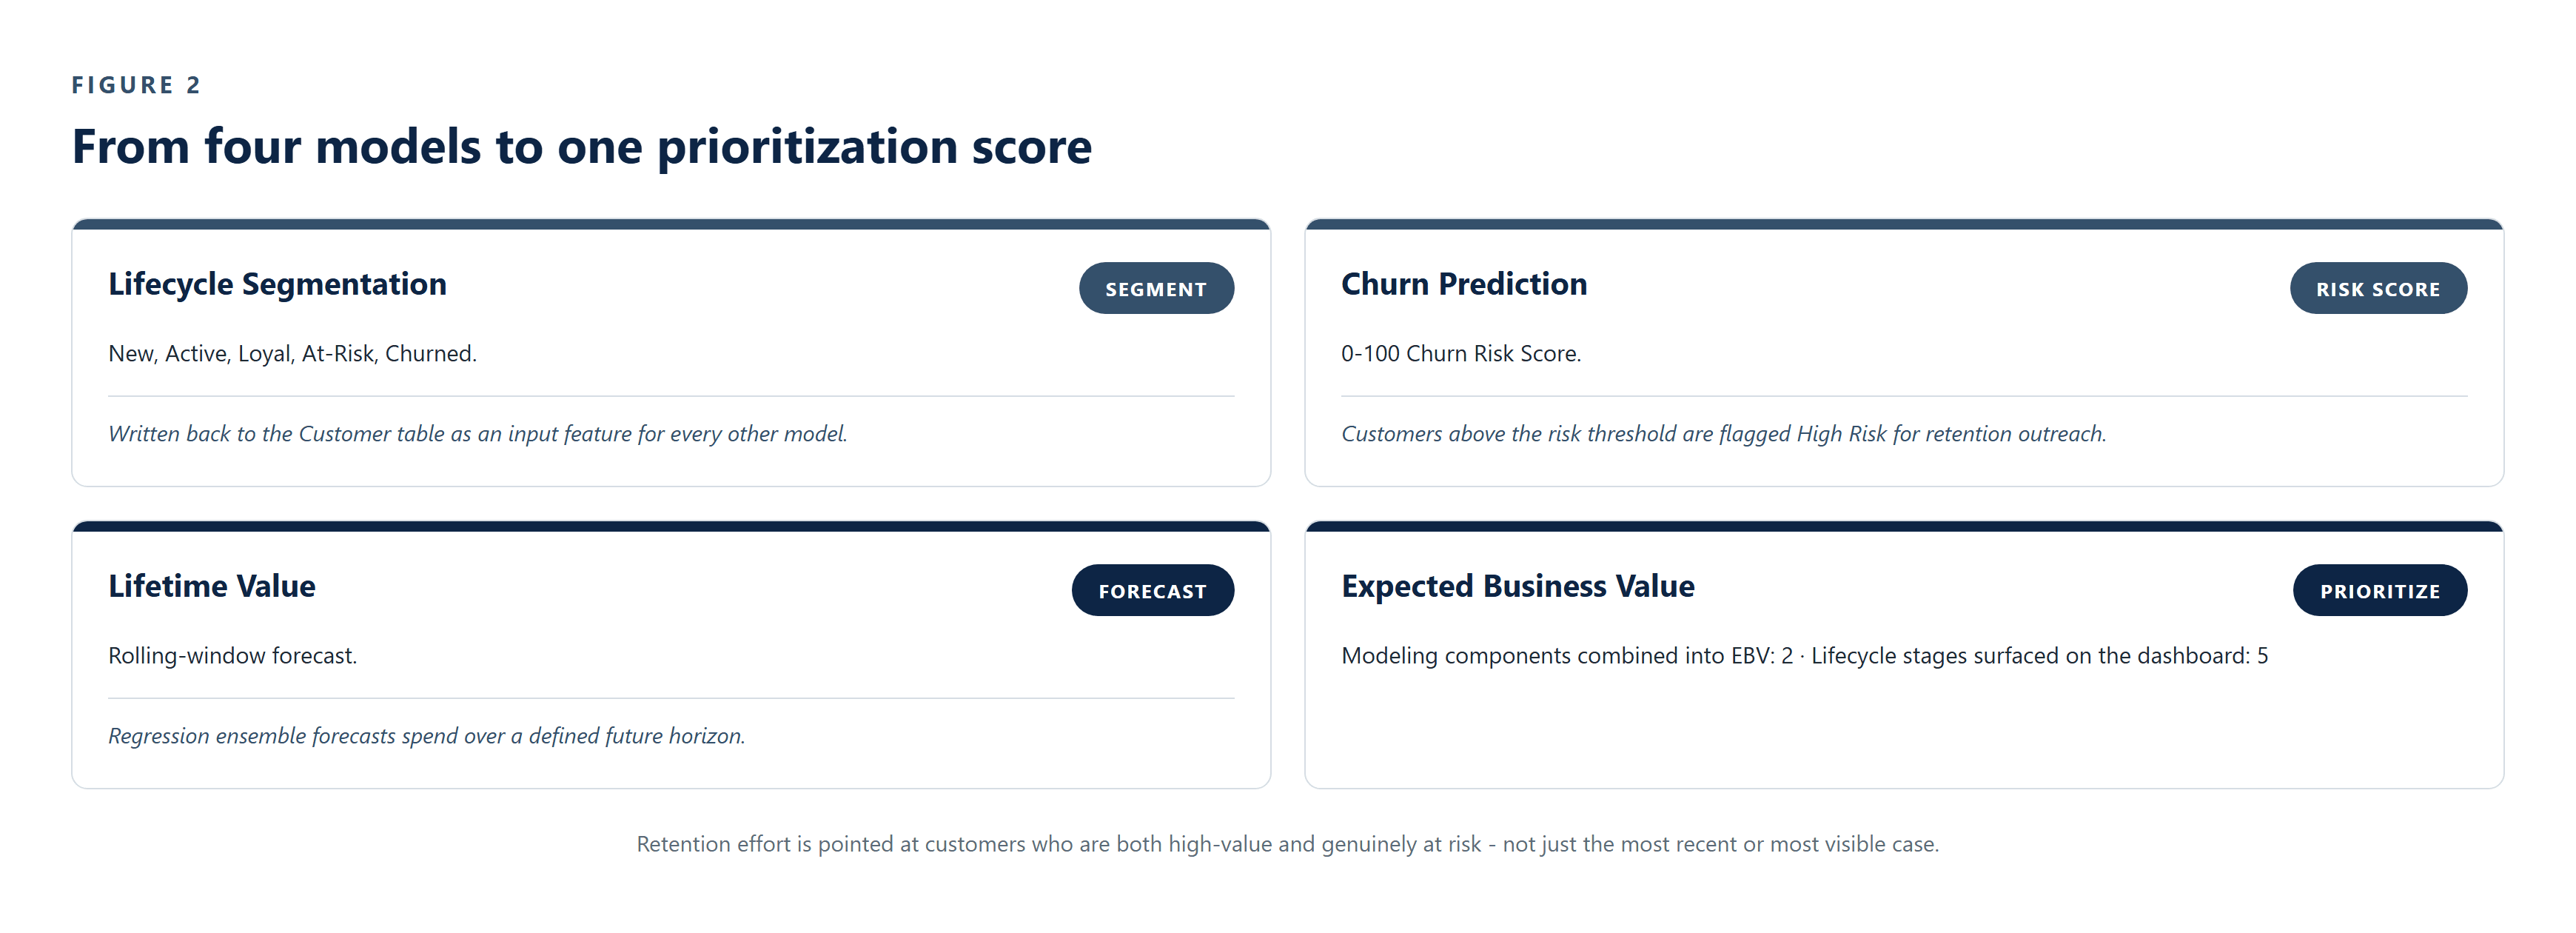
Figure 2 - How the four modeling components combine into a single business-facing view, with Expected Business Value prioritizing retention effort.
Design note The Engagement table (campaign and login data) is wired in when available from the client's marketing stack, but is treated as optional throughout - every model is designed to degrade gracefully to transaction-only features rather than depend on it.
ENGINEERING FOR SCALE AND RELIABILITY
Several engineering decisions shape how the platform holds up across the range of data completeness and business definitions clients actually have.
Churn is defined operationally, and configurably
churn is not a fixed rule baked into the model - it's defined per client (for example, no purchase in the last 180 days) and used to generate the binary training label, so the definition matches how each business actually thinks about disengagement.
Feature sets are purpose-built per model
churn features emphasize transaction, engagement, and recency signals; LTV features add trend, temporal, and categorical signals with numeric scaling and log-transformation; next-purchase features emphasize behavioral patterns and marketing interaction - each set tuned to what its model actually needs to predict.
Multiple algorithms benchmarked, not assumed
LTV regression is evaluated across XGBoost, LightGBM, and CatBoost, with a Linear Regression model retained as an interpretable baseline rather than discarded once the more complex models outperform it.
A rolling-window approach for LTV, not a fixed cutoff
historical data from a defined lookback window is used to predict spend over a following window, with the LTV label being the customer's actual future purchase sum - keeping the prediction target grounded in real, verifiable outcomes.
Next-purchase timing and category are decoupled
predicting when a customer will buy again (regression or survival models) and predicting what they'll buy (classification, or sequential models for large catalogs) are treated as two coordinated but independently validated sub-models, not one model doing both jobs.
Evaluation matched to each model's output type
RMSE and MAE measure error magnitude for LTV and purchase-timing regressions, R² measures variance explained for LTV, and F1-score plus Top-K Accuracy evaluate the churn and next-category classifiers - each model judged on the metric appropriate to what it actually predicts.
DELIVERY APPROACH
The engagement moved from fragmented source data to a working, four-component analytics platform in five phases.
1. Consolidate the data architecture - defined and built the four core tables - Customer, Transactions, Product, and Engagement - as the foundation every downstream model would read from.
2. Build the analytics pipeline - implemented cleaning, deduplication, and RFM/behavioral feature derivation, merging everything into a single customer-level analytics table.
3. Build segmentation and churn - delivered RFM-based lifecycle clustering and a classification-based churn engine with a configurable risk threshold.
4. Build LTV modeling and Expected Business Value - delivered the rolling-window LTV regression model and combined it with churn probability into the EBV prioritization score.
5. Build next-purchase prediction and the dashboard - delivered the timing and category sub-models, then surfaced all four components in a business-facing Power BI / Tableau dashboard.
RESULTS AND IMPACT

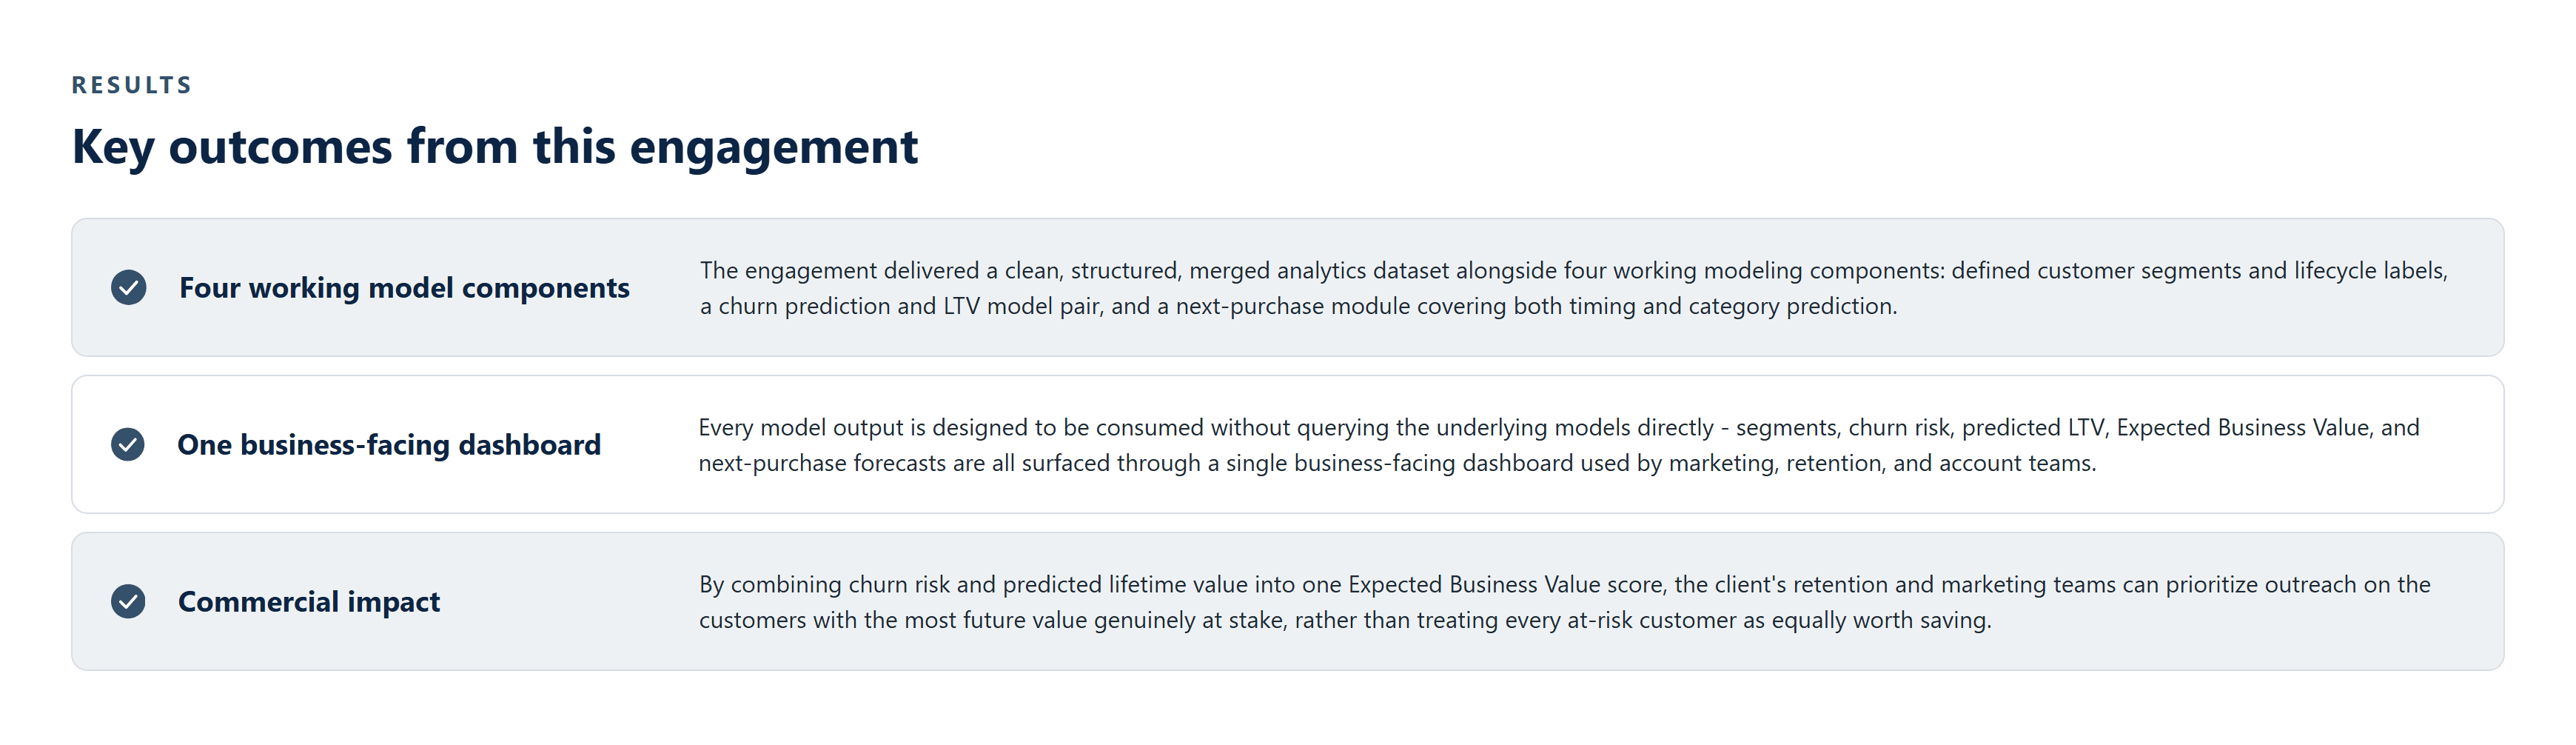
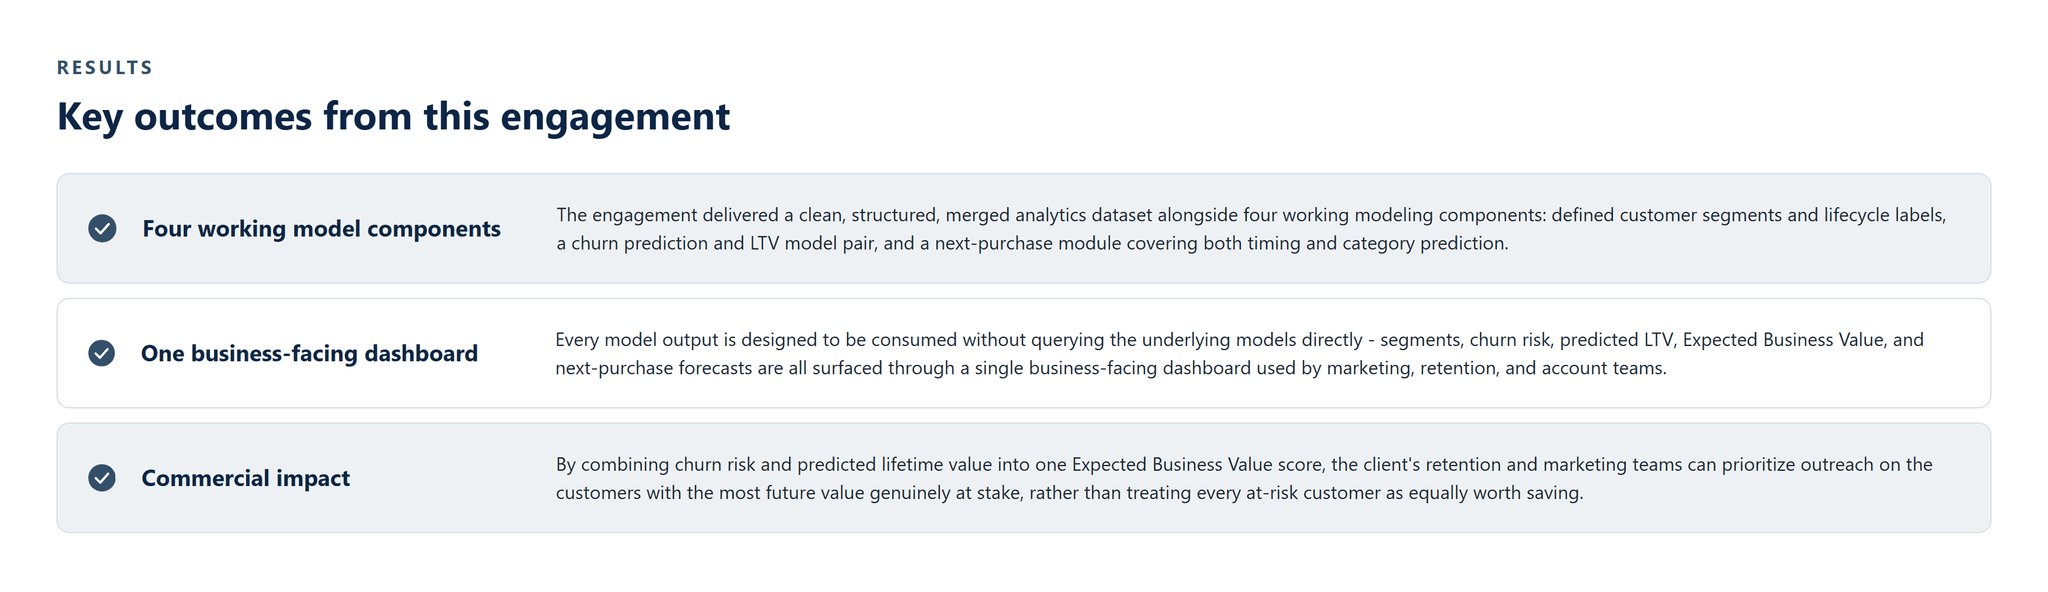
Figure - Key outcomes from this engagement.
The engagement delivered a clean, structured, merged analytics dataset alongside four working modeling components: defined customer segments and lifecycle labels, a churn prediction and LTV model pair, and a next-purchase module covering both timing and category prediction.
Every model output is designed to be consumed without querying the underlying models directly - segments, churn risk, predicted LTV, Expected Business Value, and next-purchase forecasts are all surfaced through a single business-facing dashboard used by marketing, retention, and account teams.
What it enabled commercially
By combining churn risk and predicted lifetime value into one Expected Business Value score, the client's retention and marketing teams can prioritize outreach on the customers with the most future value genuinely at stake, rather than treating every at-risk customer as equally worth saving.
WHY PFACTORIAL
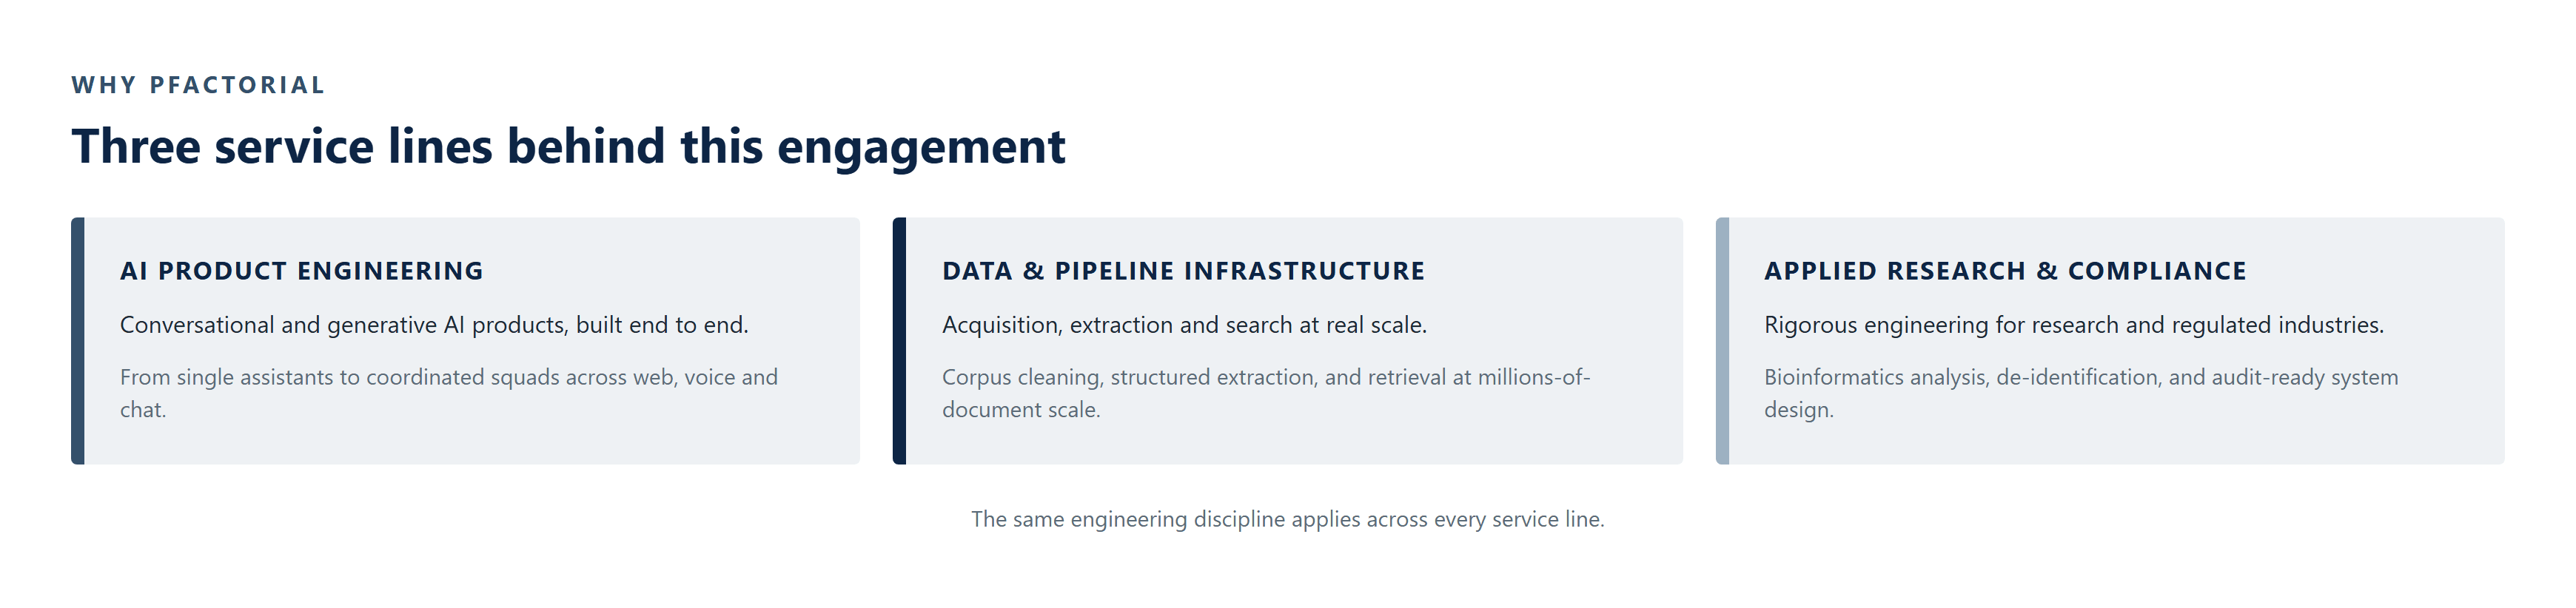
This engagement draws on Pfactorial's data and pipeline infrastructure capability: consolidating fragmented operational data into a single analysis-ready layer and combining several purpose-built models into one prioritization score business teams can act on directly.

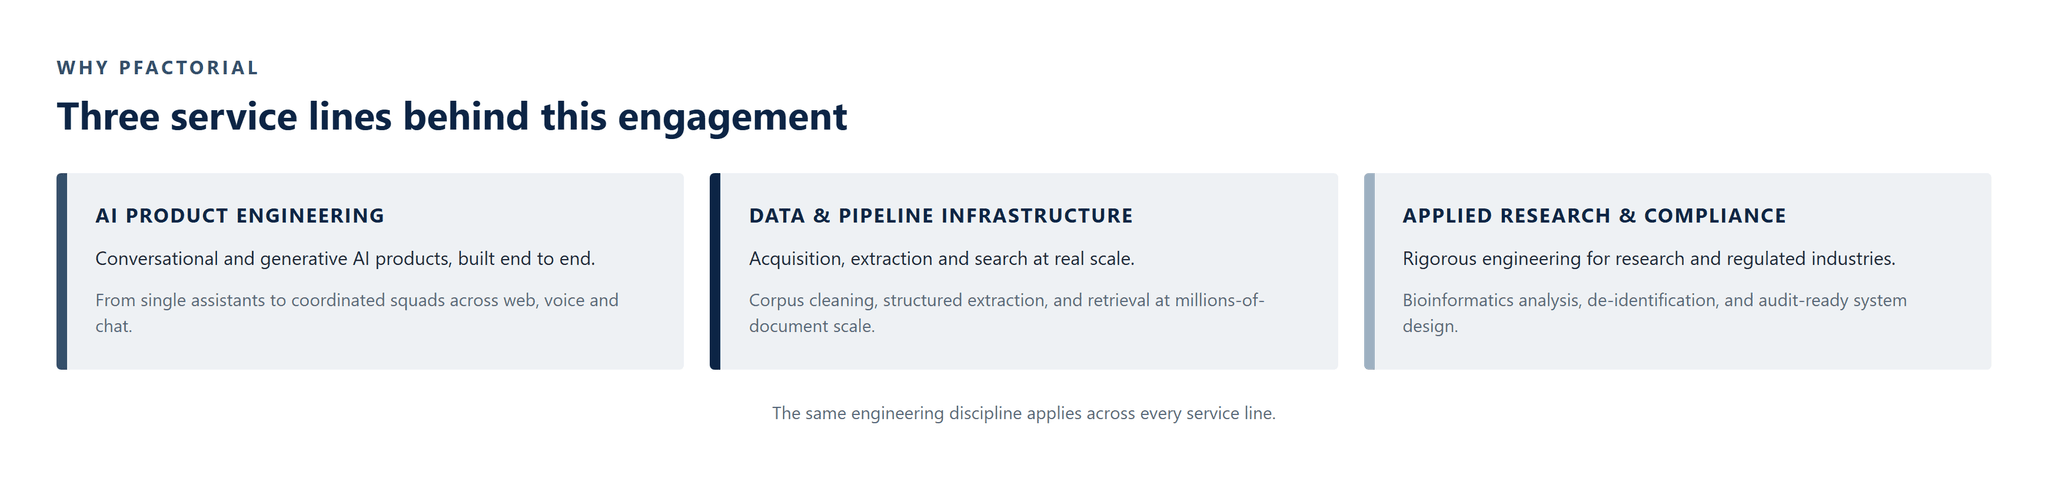
Figure - Service lines this engagement draws on.
Engagement enquiries Pfactorial Technologies works with teams whose customer data is spread across CRM, ERP, and point-of-sale systems with no consolidated, forward-looking view. If you are evaluating whether a customer analytics platform is worth building properly, we are happy to give you an honest read on scope, cost, and risk before anyone commits to anything. · pfactorial.ai
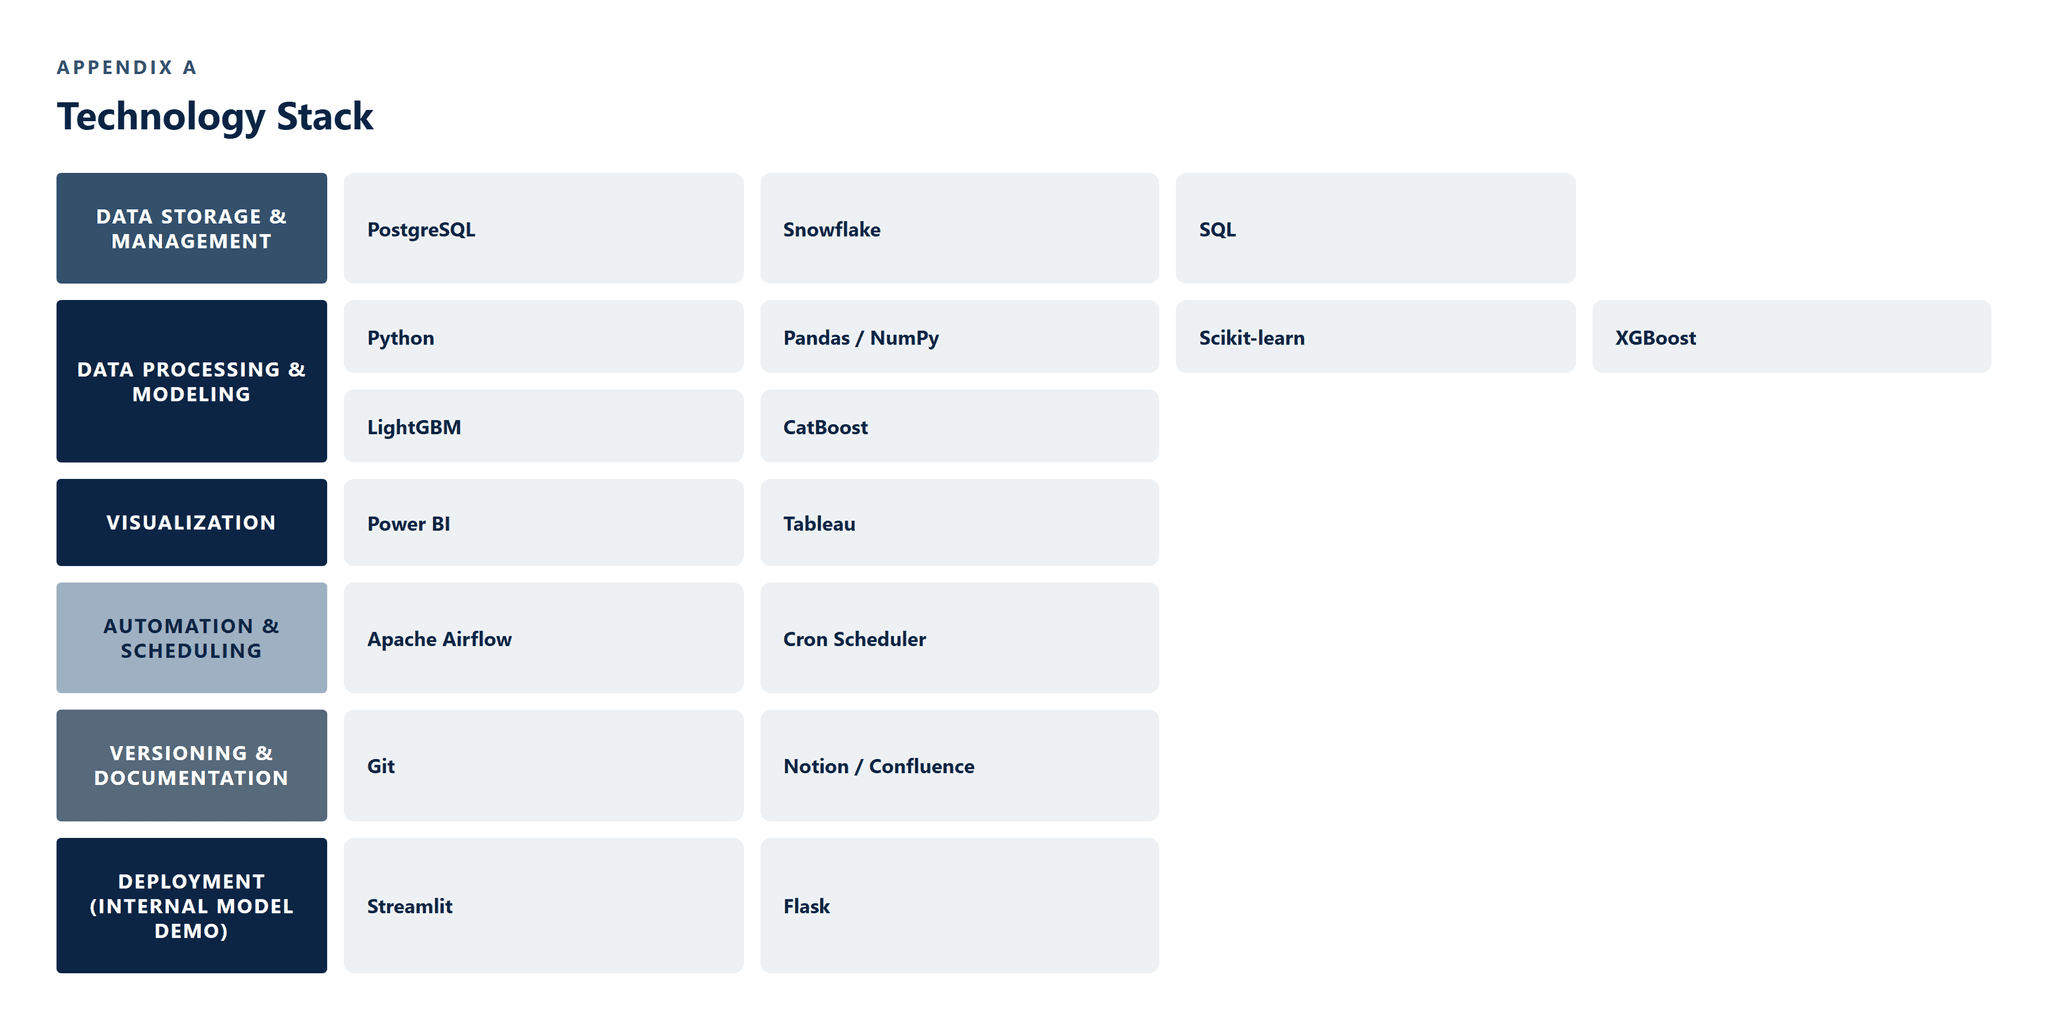
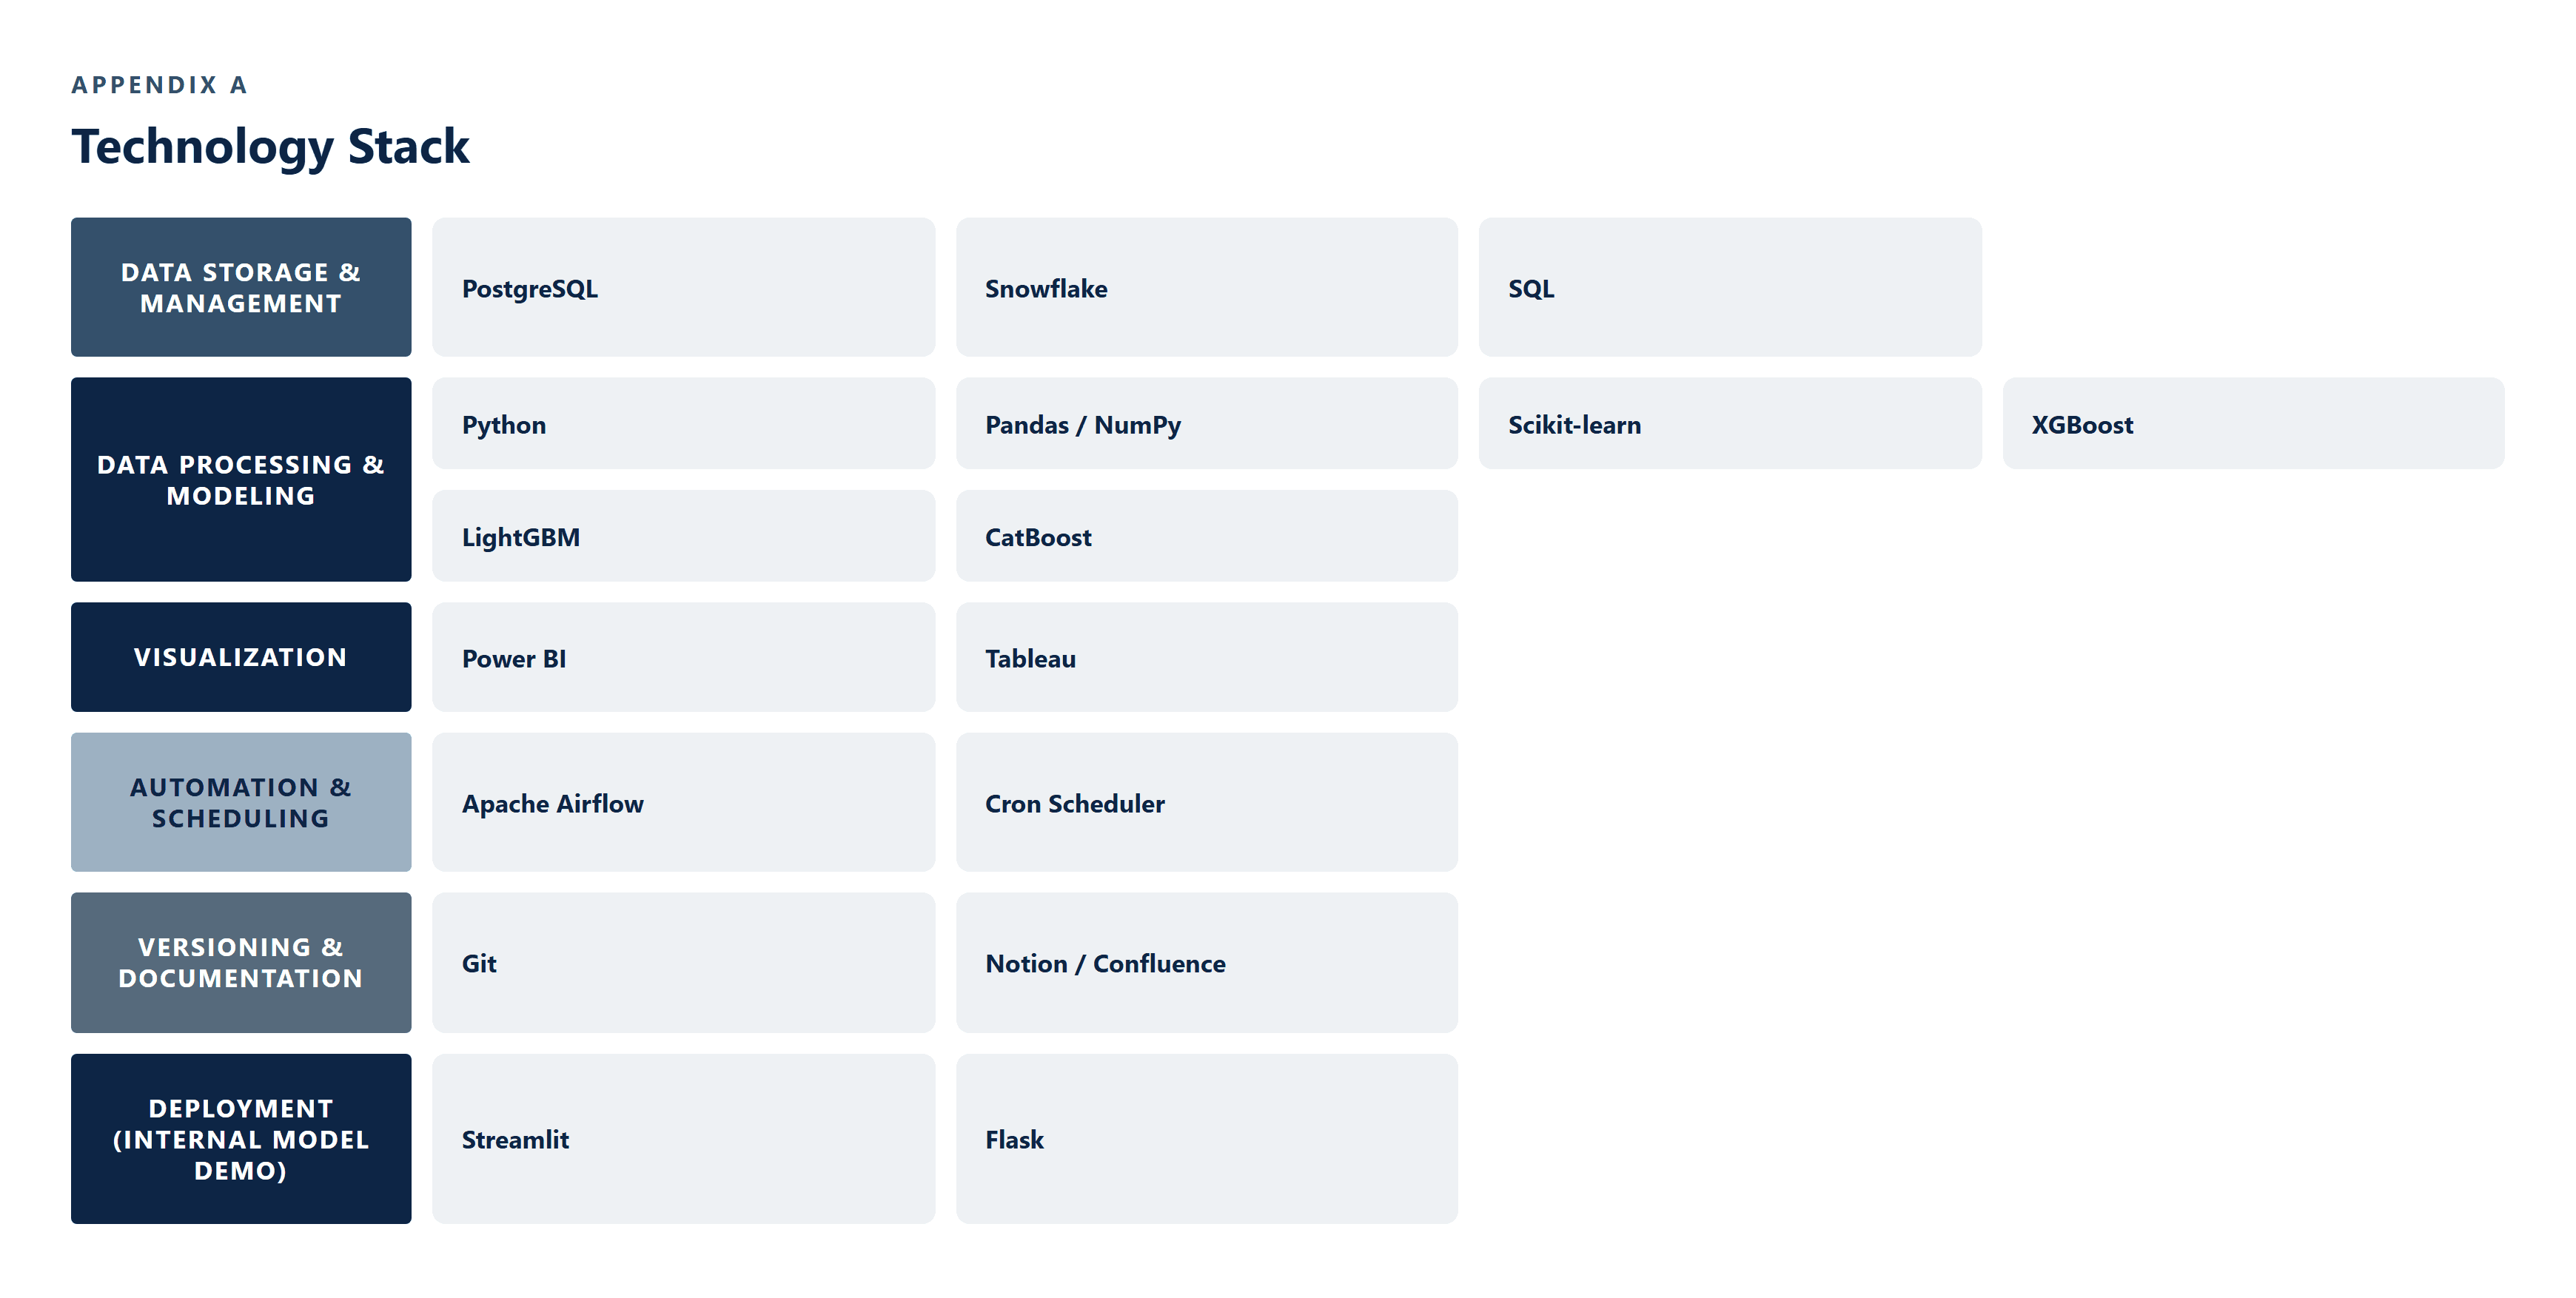
APPENDIX A - TECHNOLOGY STACK
The technology stack underpinning the system, grouped by the layer it serves.

Result and Analysis
ENGAGEMENT SNAPSHOT
A unified analytics platform that scores every customer's lifecycle stage, churn risk, lifetime value, and next likely purchase from a single consolidated data layer.
CASE STUDIES
You might also like...

Finance & Payments
Aug 21, 20266 min readRead

Analytics & BI DashboardsAutomotive & Vehicle
A Five-Capability Computer Vision Platform for Vehicle Identity, Traffic, and Parking Intelligence
Aug 21, 20267 min readRead

RAG & Semantic Search
A Layered Analytics Platform for CXO-Level Decision-Making
Aug 21, 20268 min readRead

OCR & Document ExtractionRAG & Semantic SearchFinance & Payments
A Purpose-Built Search Engine for 1.6 Million SEC & SEDAR Agreements
Aug 21, 20267 min readRead

Voice AI & TelephonyFinance & PaymentsE-commerce & Retail
A Reusable Prompt Architecture for Human-Sounding Voice AI Across Industries
Aug 21, 20267 min readRead

A Self-Service Anomaly Detection Platform Spanning Statistical and Machine-Learning Methods
Aug 21, 20266 min readRead