Back
Analytics & BI Dashboards
A Layered Analytics Platform for CXO-Level Decision-Making
An enterprise analytics platform combining a query-optimized datamart with specialized AI insight engines for trends, anomalies, forecasts, and scenario analysis - accessible through dashboards or plain-language conversation.
August 21, 2026
Share
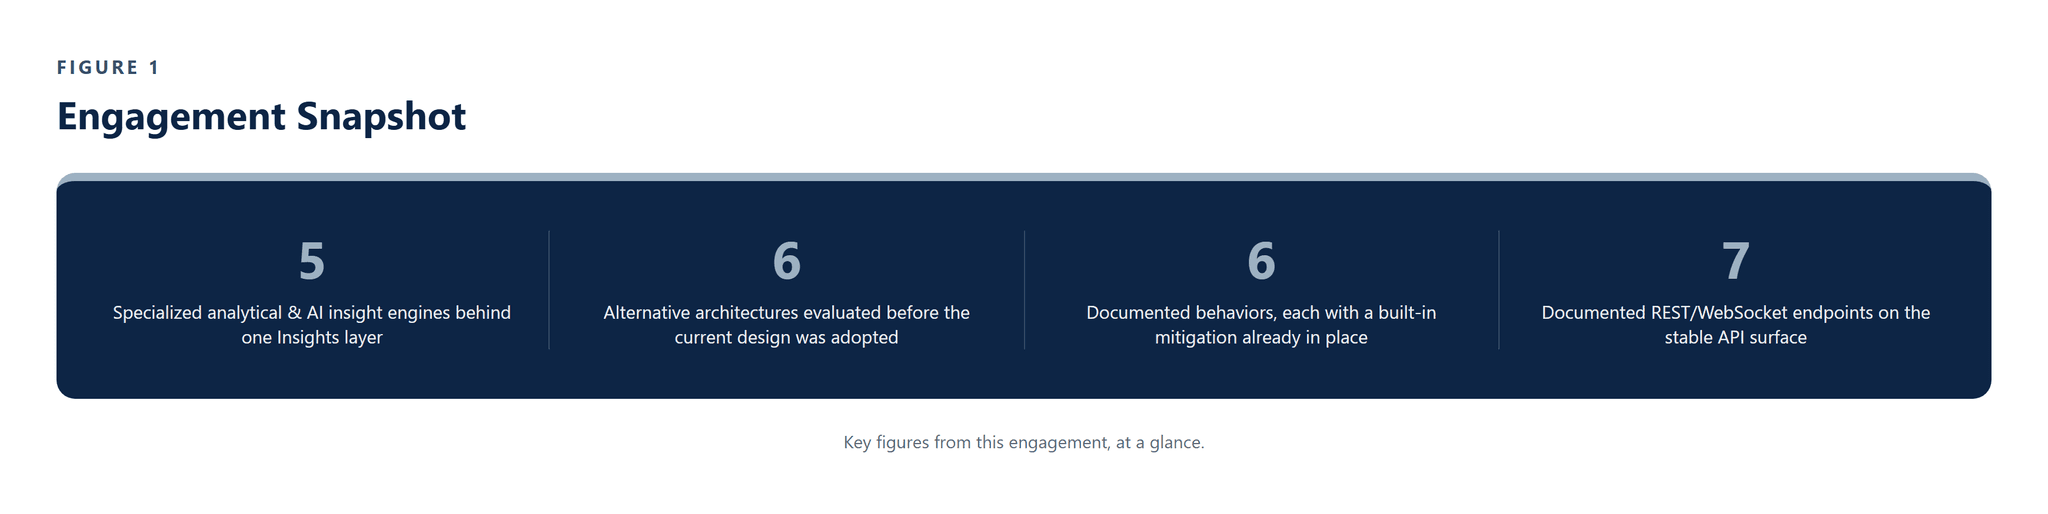
ENGAGEMENT SNAPSHOT

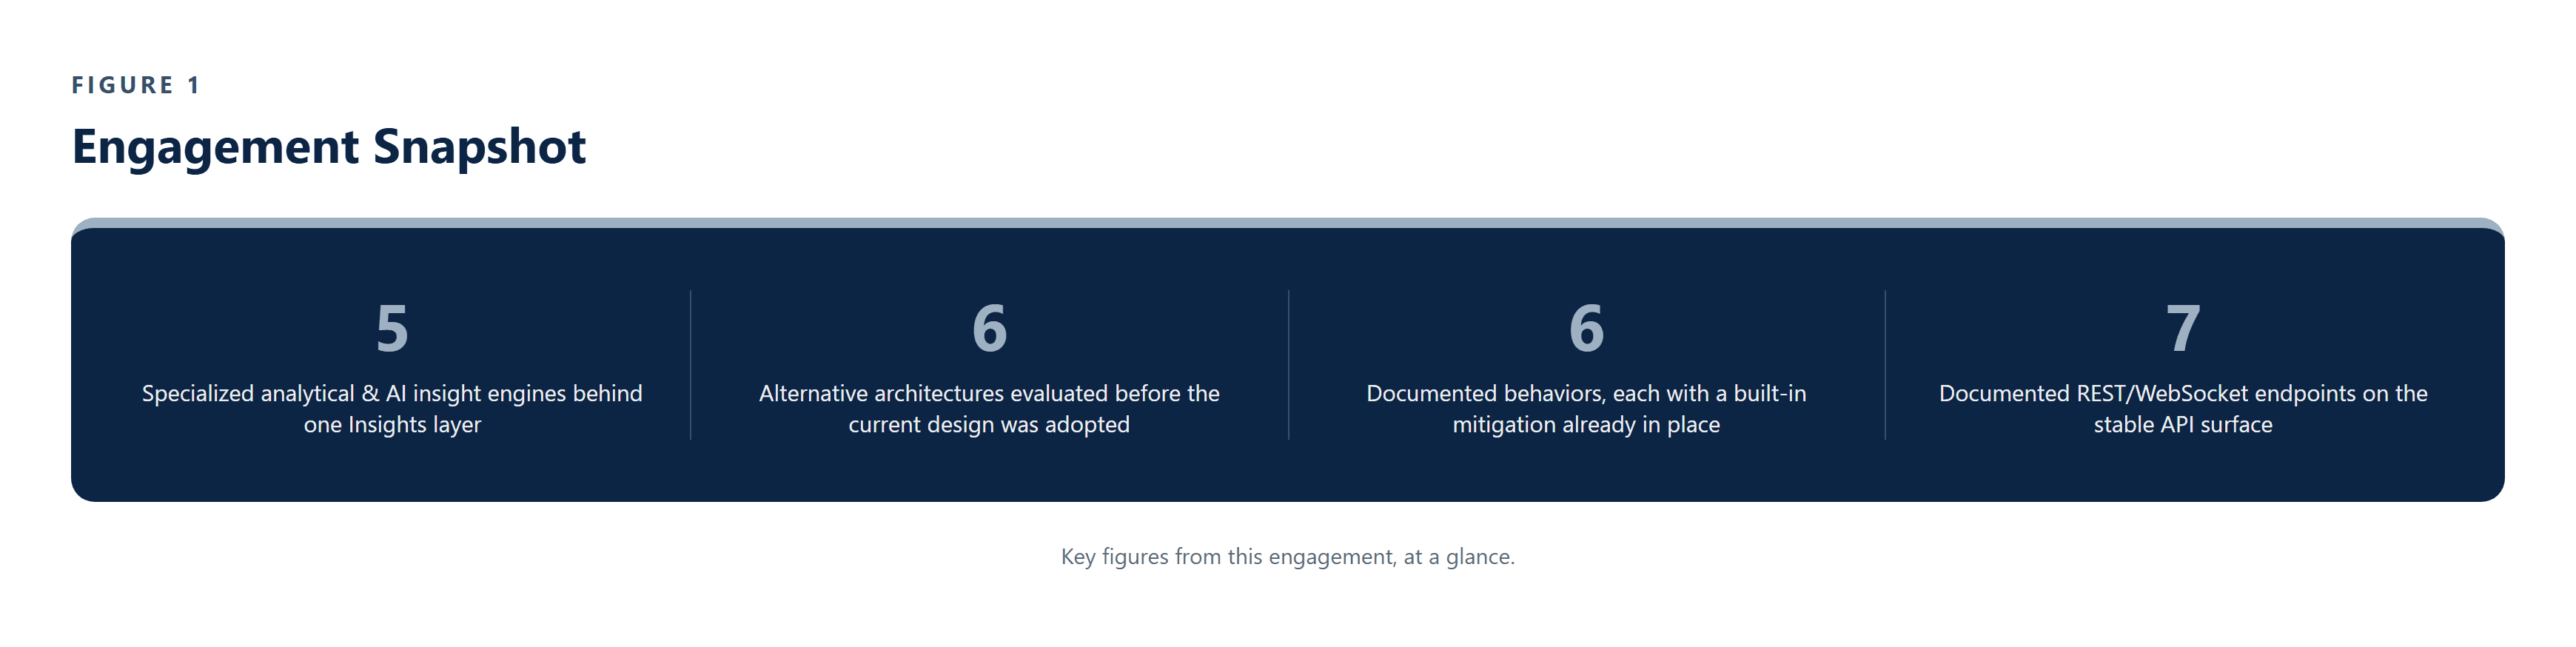
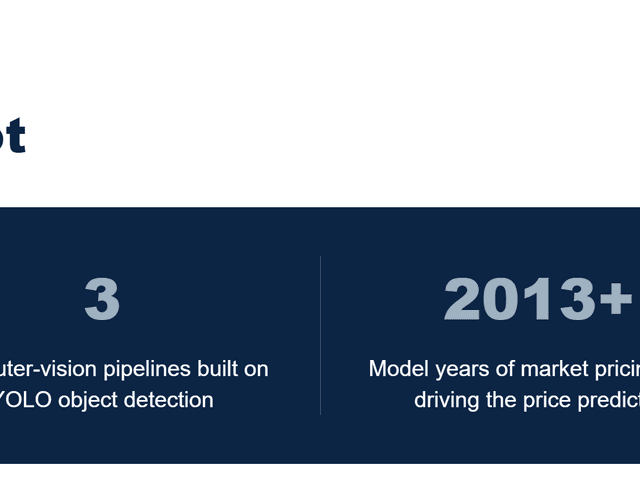
Figure 1 - Key figures from this engagement, at a glance.
EXECUTIVE SUMMARY
Our client's executives needed a single 360-degree view across Sales, Finance, Inventory, Marketing, and Service data, but that data lived in separate source systems, and turning it into a trustworthy, real-time answer meant more than a dashboard refresh - it meant validated KPIs, detected trends and anomalies as they emerged, and forecasts an executive could act on without waiting for an analyst.
Pfactorial Technologies built the Executive Vista Platform: a layered pipeline that ingests structured and unstructured data securely, transforms it into a star-schema datamart, and runs it through five specialized analytical engines - KPI, trend, anomaly, forecasting, and scenario - unified under a single Insights layer rather than five separately deployed services.
Every output, whether reached through the executive dashboard or the AI chat interface, is traceable back to an auditable data and reasoning path, and every forecast returns alongside its own confidence interval and accuracy diagnostics rather than a single unqualified number.
Why this engagement is representative This engagement demonstrates Pfactorial's approach to enterprise analytics platforms: merging specialized reasoning engines into one auditable, operationally simple layer rather than a sprawl of standalone agents, and defaulting every AI-derived output to a documented, traceable reasoning path.
THE CHALLENGE
Delivering a genuinely trustworthy executive view meant solving several problems that a simple dashboard rollup does not address.
1. Data lived across disconnected functional systems
Sales, Finance, Inventory, Marketing, and Service data each came from separate source systems, with no unified, query-optimized layer an executive-facing tool could reliably read from.
2. Standard/composite metrics needed to be trustworthy, not just fast
KPIs, trends, and anomalies had to be computed with lineage and quality scoring intact, so an executive could trust a number rather than merely see it rendered quickly.
3. Forecasts and scenarios needed honesty built in
Forecasting and what-if scenario outputs are estimates, not guarantees, and needed to be explicit about that - returned with confidence intervals and accuracy diagnostics rather than a single number presented as certain.
4. AI reasoning over sensitive data needed explicit gating
Conversational access to insights meant the system could potentially reason over protected or sensitive attributes, which required consent and safety rules enforced as a standard part of every synthesized answer, not an afterthought.
The real brief Not a dashboard that displays numbers faster, but an analytics platform where every KPI, trend, anomaly, forecast, and scenario is auditable back to its source and honest about its own uncertainty.
THE SOLUTION
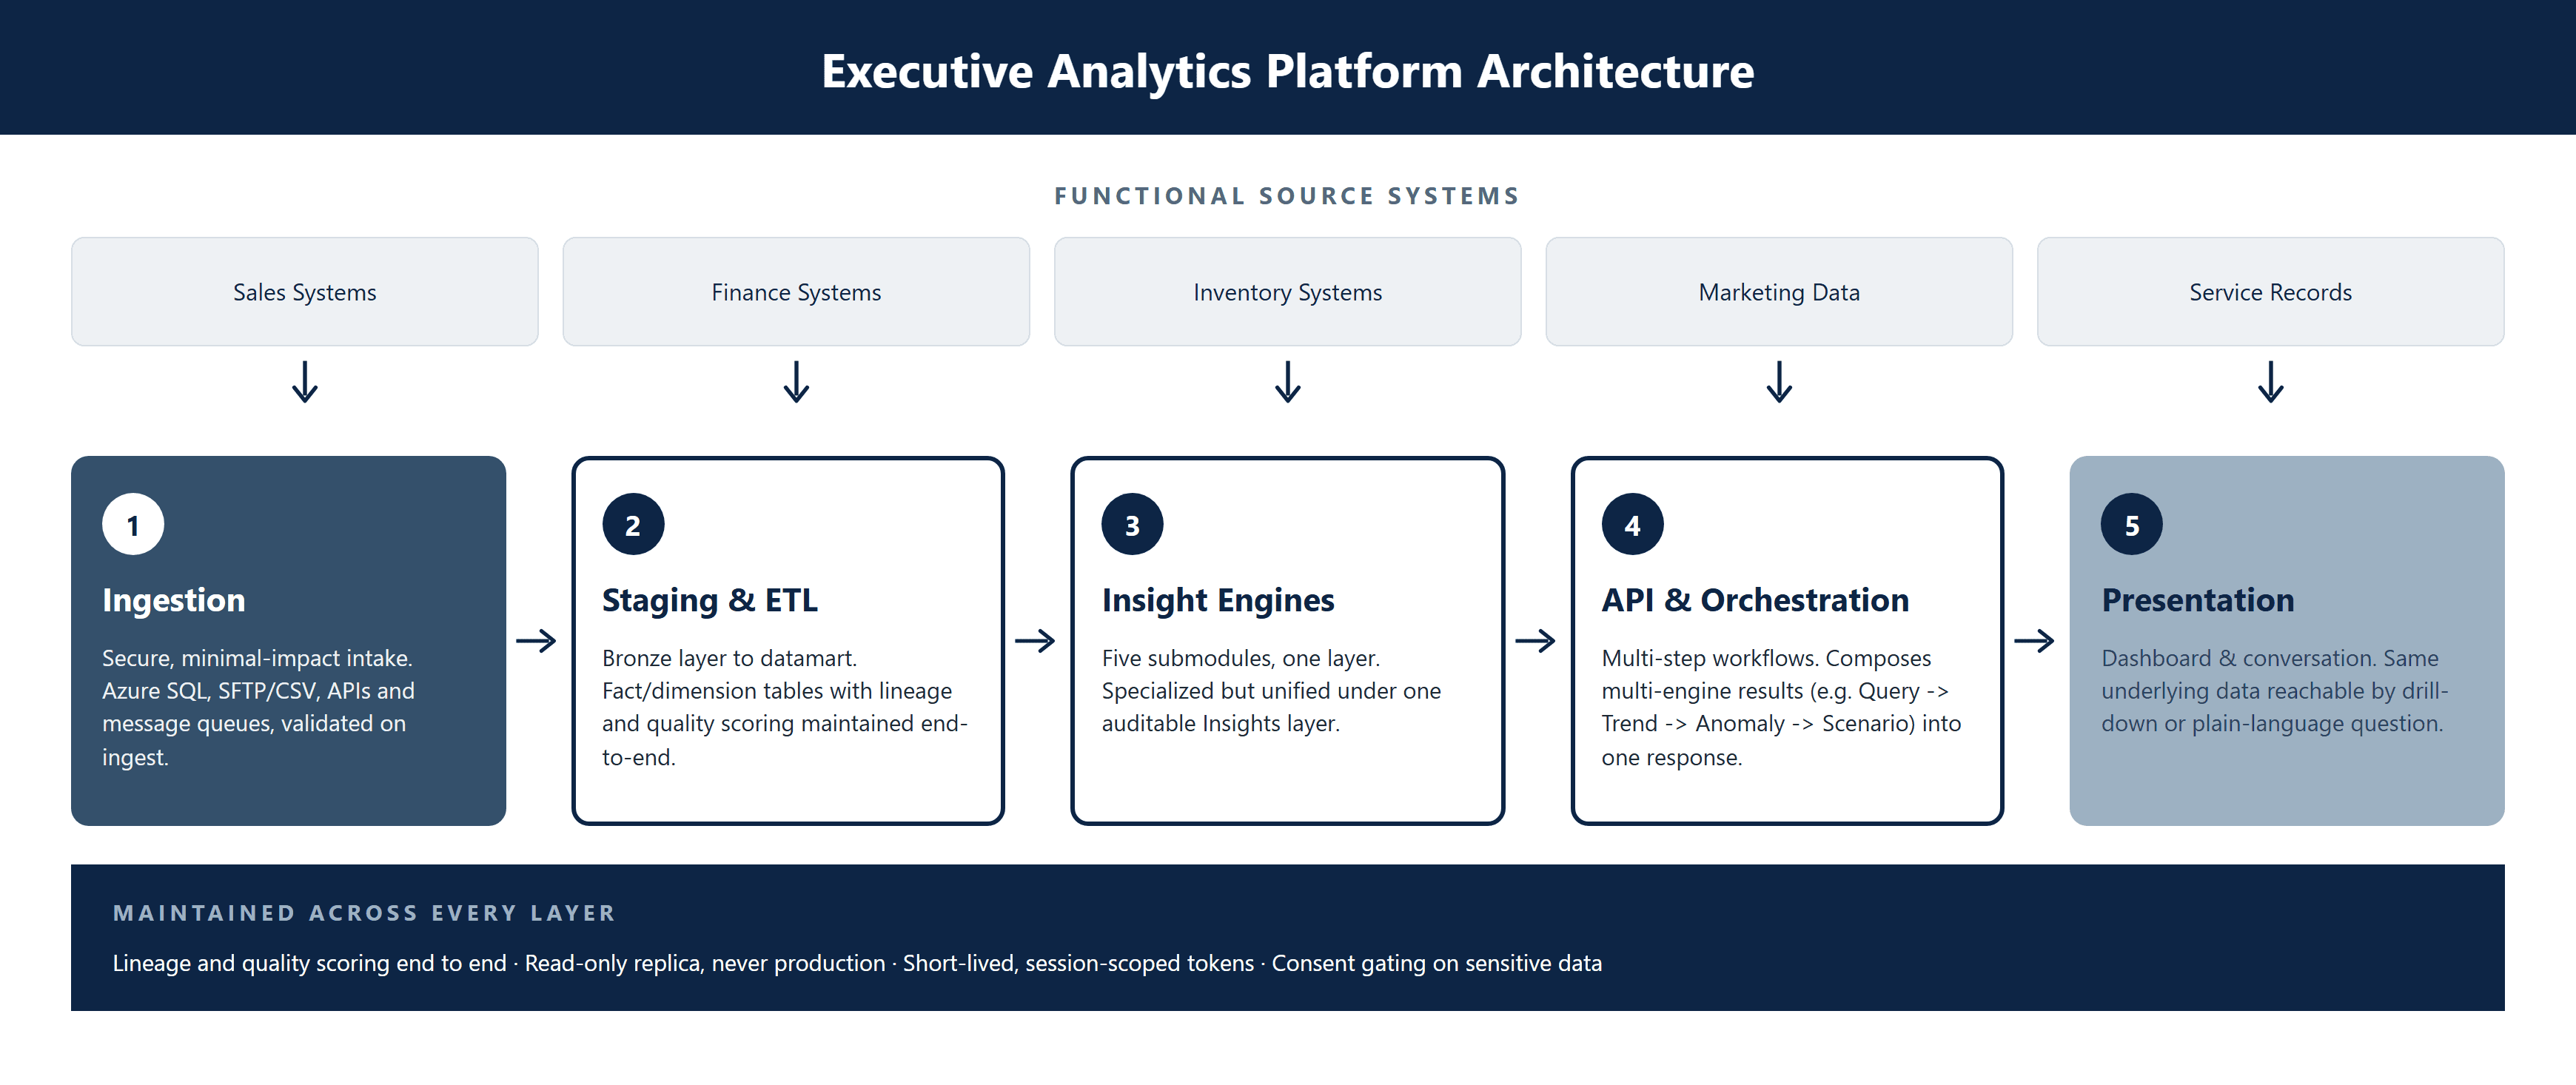
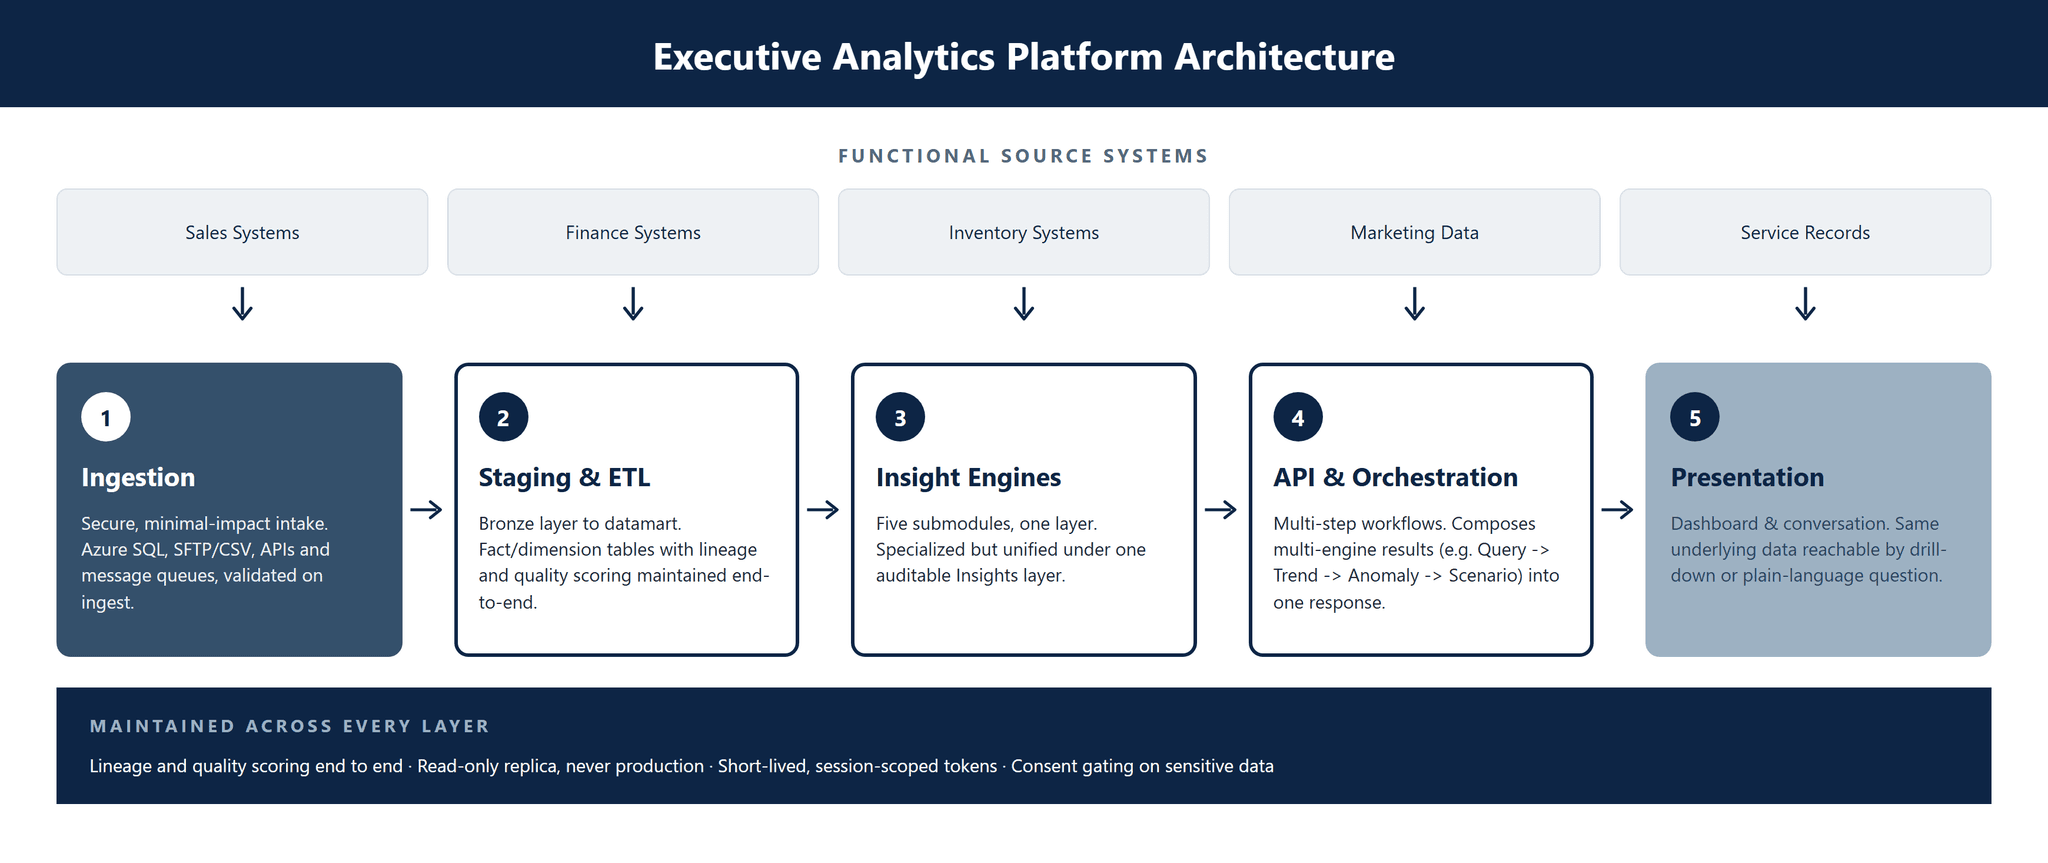
Pfactorial built the platform as a layered pipeline: source systems feed ingestion, ingestion lands in staging, ETL builds a query-optimized datamart, and a unified insights layer reads from that datamart to power both dashboards and conversational access.

Figure 1 - System architecture: source systems through ingestion and staging, ETL into the datamart, and out through the analytical engines to the API and presentation layers.
Architectural principles
- One datamart, purpose-built for KPI queries - raw inputs are transformed into fact and dimension tables on a star schema, with pre-aggregated summary tables for the most common metrics, rather than querying source systems directly at read time.
- Merged insight engines, not standalone agents - KPI, trend, anomaly, forecasting, and scenario capabilities are implemented as specialized submodules within a single Analytical & AI Insights Layer, reducing operational complexity while preserving modular, independently testable, fully auditable reasoning paths.
- Read-only replica, never direct production access - AI and model queries run against a dedicated read-only replica and data access layer rather than live transactional systems, isolating production traffic from analytical load entirely.
- Short-lived tokens over long-lived credentials - conversational LLM access is issued through short-lived, session-scoped tokens rather than static API keys, limiting the exposure window of any single credential.
CAPABILITIES DELIVERED
The platform's capabilities span validated metrics, detected change, forward-looking estimates, and a conversational layer that ties them together.
CAPABILITY | WHAT IT DOES |
|---|---|
KPI Engine | Pre-computes standard KPIs and calculates complex metrics on demand, backed by a Redis cache for low-latency retrieval. |
Trend & Time-Series Engine | Detects directionality, seasonality, acceleration, and breakpoints using time-series decomposition and rolling statistics. |
Anomaly Detection Engine | Combines statistical thresholds with ML-based methods to flag multidimensional anomalies, each with a severity score and suggested follow-up query. |
Forecasting Engine | Produces multi-horizon forecasts reconciled across hierarchies, with automated per-metric model selection and accuracy diagnostics. |
Scenario / What-If Engine | Runs parametric simulations using sensitivity analysis and elasticity assumptions, translating plain-language scenarios into model parameters. |
Insight Synthesis & Conversational Access | Aggregates engine outputs into narratives and prescriptive flags, exposed through both an executive dashboard and an AI chat interface. |
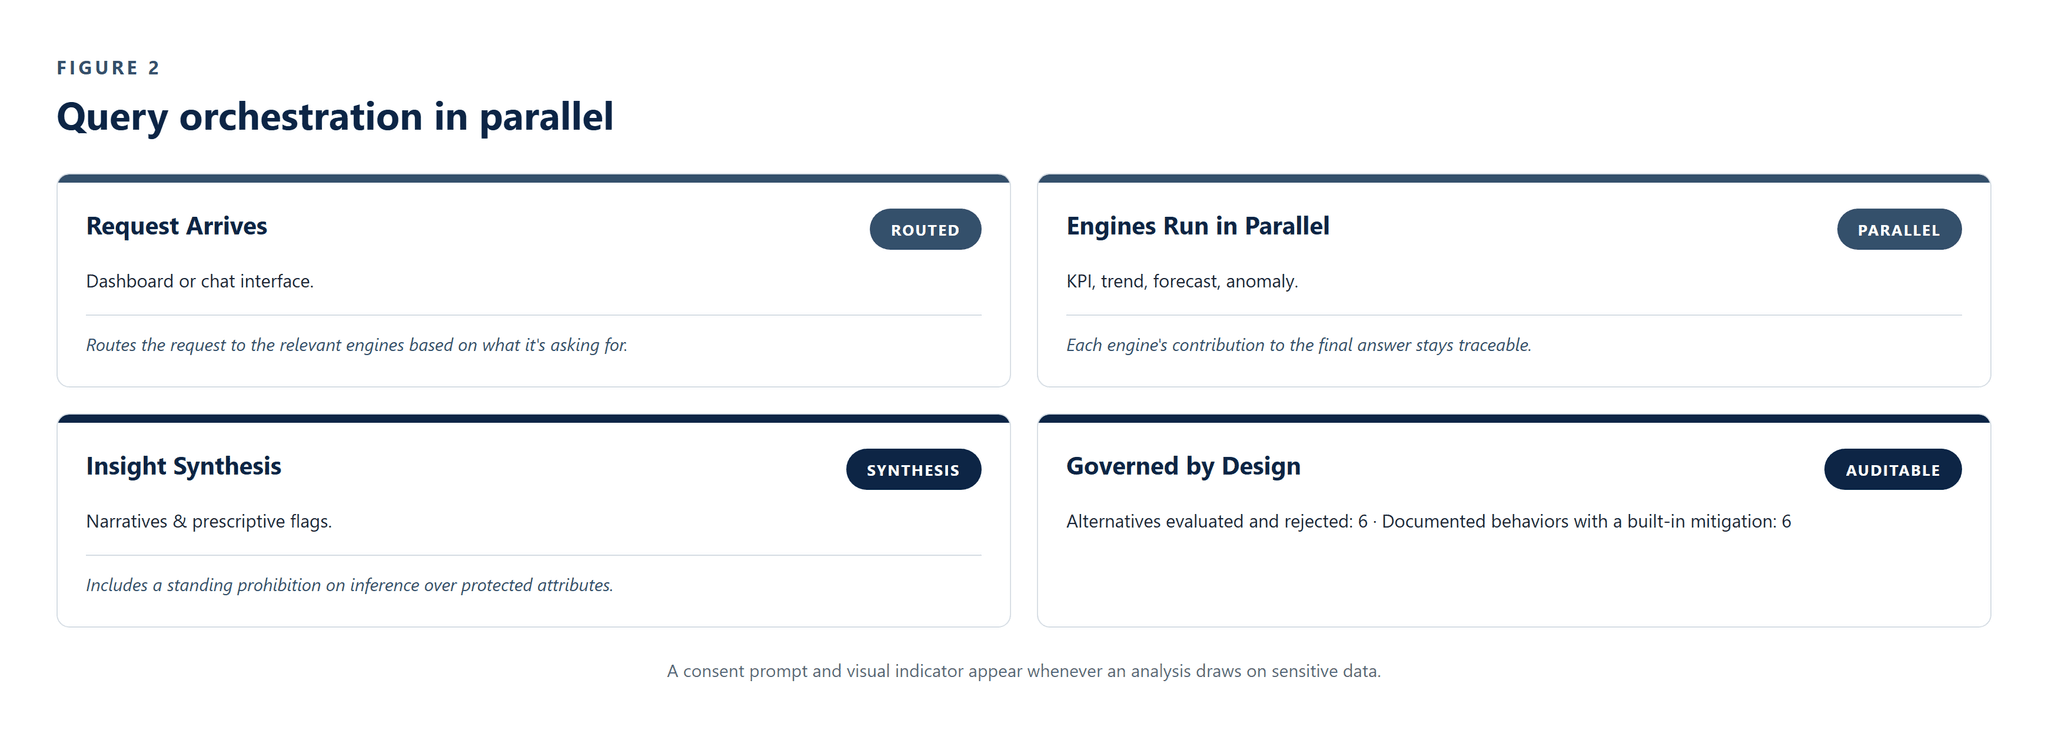
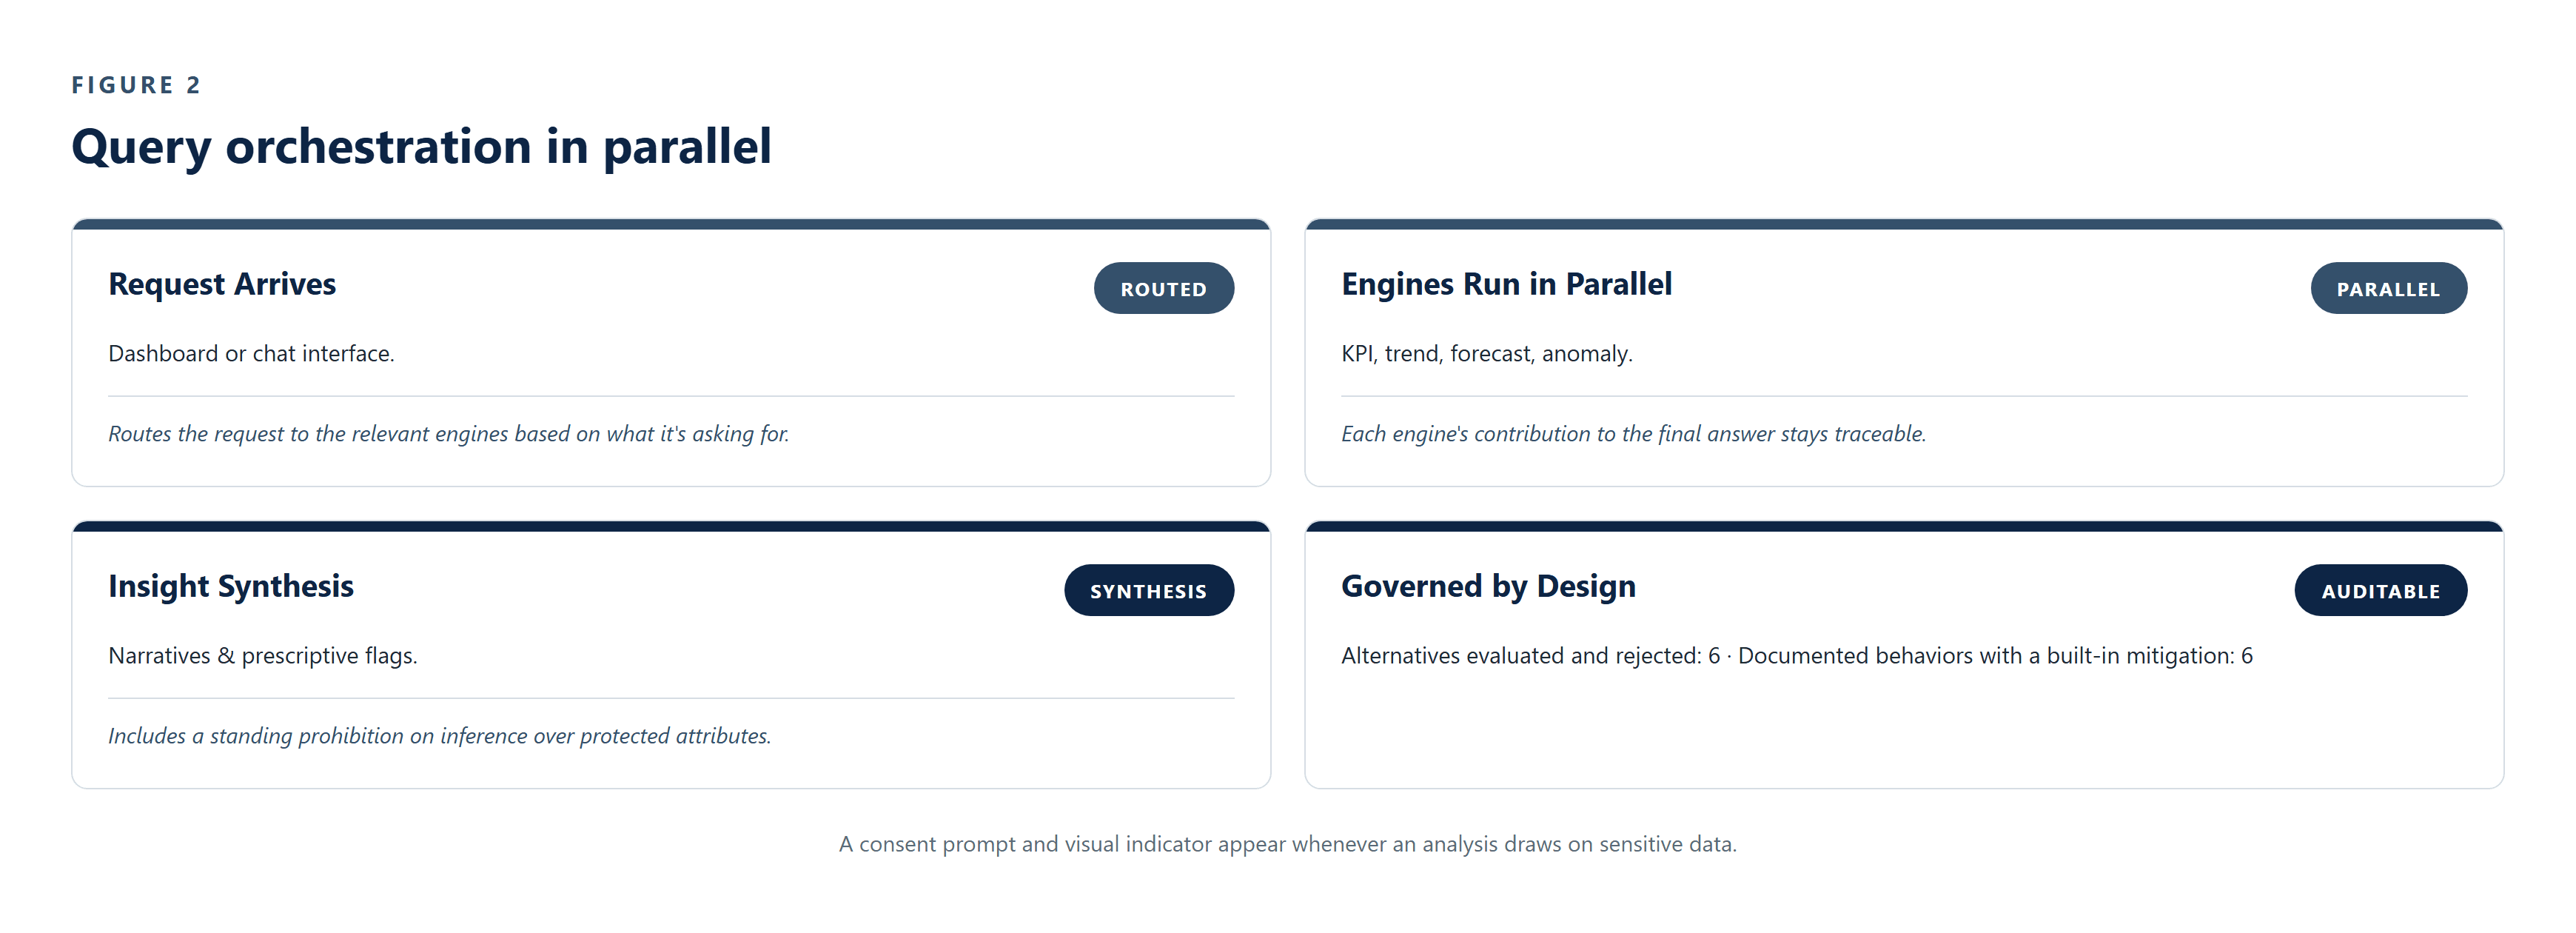
Figure 2 - Query orchestration: a request is routed through the API/orchestrator to the relevant engines in parallel, composed by the Insight Synthesis layer.
Design note The five insight engines are deliberately merged into one modular layer rather than deployed as separate standalone agents - fewer independently deployed services to monitor and version, while each engine's contribution to a given answer stays fully auditable.
ENGINEERING FOR SCALE AND RELIABILITY
Several engineering decisions distinguish a platform executives can actually rely on from one that merely looks good in a demo.
Forecast model selection is automated and metric-specific
candidate time-series and ML models are scored against historical accuracy diagnostics per metric and hierarchy level, and the best-performing model is applied at inference time rather than one fixed model used everywhere.
Anomaly detection runs both methods on every pass
statistical thresholds (z-score / IQR) and ML-based methods (Isolation Forest, density clustering) are applied together on every scored slice, rather than choosing one approach up front, so both univariate outliers and multidimensional anomalies are covered.
Production traffic is isolated at the network level
Private Endpoints and VPN connectivity isolate source-system ingestion from production traffic, with retry/backoff and dead-letter handling protecting the pipeline from malformed records.
Every AI reasoning step over sensitive data requires explicit consent
a consent UI gates any reasoning step touching sensitive or unstructured data, sensitive artifacts are not persisted unless opted in, and are encrypted at rest when they are.
Alternatives were evaluated and rejected on evidence, not by default
standalone per-capability agents, single-model forecasting, uncached KPI computation, and long-lived LLM API keys were each evaluated and specifically not adopted in favor of the current design.
Multi-engine orchestration is kept low-latency by design
a Redis cache-first design and parallel engine invocation keep hot paths responsive, with OpenTelemetry tracing monitoring latency across the multi-engine request path.
DELIVERY APPROACH
The platform was delivered as a layered build, moving from source connectivity through to a governed, conversational analytics surface.
1. Build the ingestion layer - connected Azure SQL, SFTP/CSV, APIs, and message queues with schema discovery and validation at ingest time, landing every record in a staging area with audit metadata and lineage.
2. Build the datamart - transformed raw inputs into a star-schema datamart with fact/dimension tables, pre-aggregated summary tables, and end-to-end lineage and quality scoring.
3. Build the insight engines - delivered the KPI, trend, anomaly, forecasting, and scenario engines as specialized submodules within one unified, auditable Insights layer.
4. Build the API and orchestration layer - exposed REST/WebSocket endpoints on FastAPI, with session/auth management, rate limiting, and multi-step workflow orchestration across engines.
5. Build the interaction layer - delivered the React executive dashboard alongside an AI chat interface with consent prompts for any analysis drawing on sensitive data.
6. Evaluate and harden the architecture - benchmarked six architectural alternatives against the adopted design and documented known behaviors with their built-in mitigations before considering the platform production-ready.
RESULTS AND IMPACT

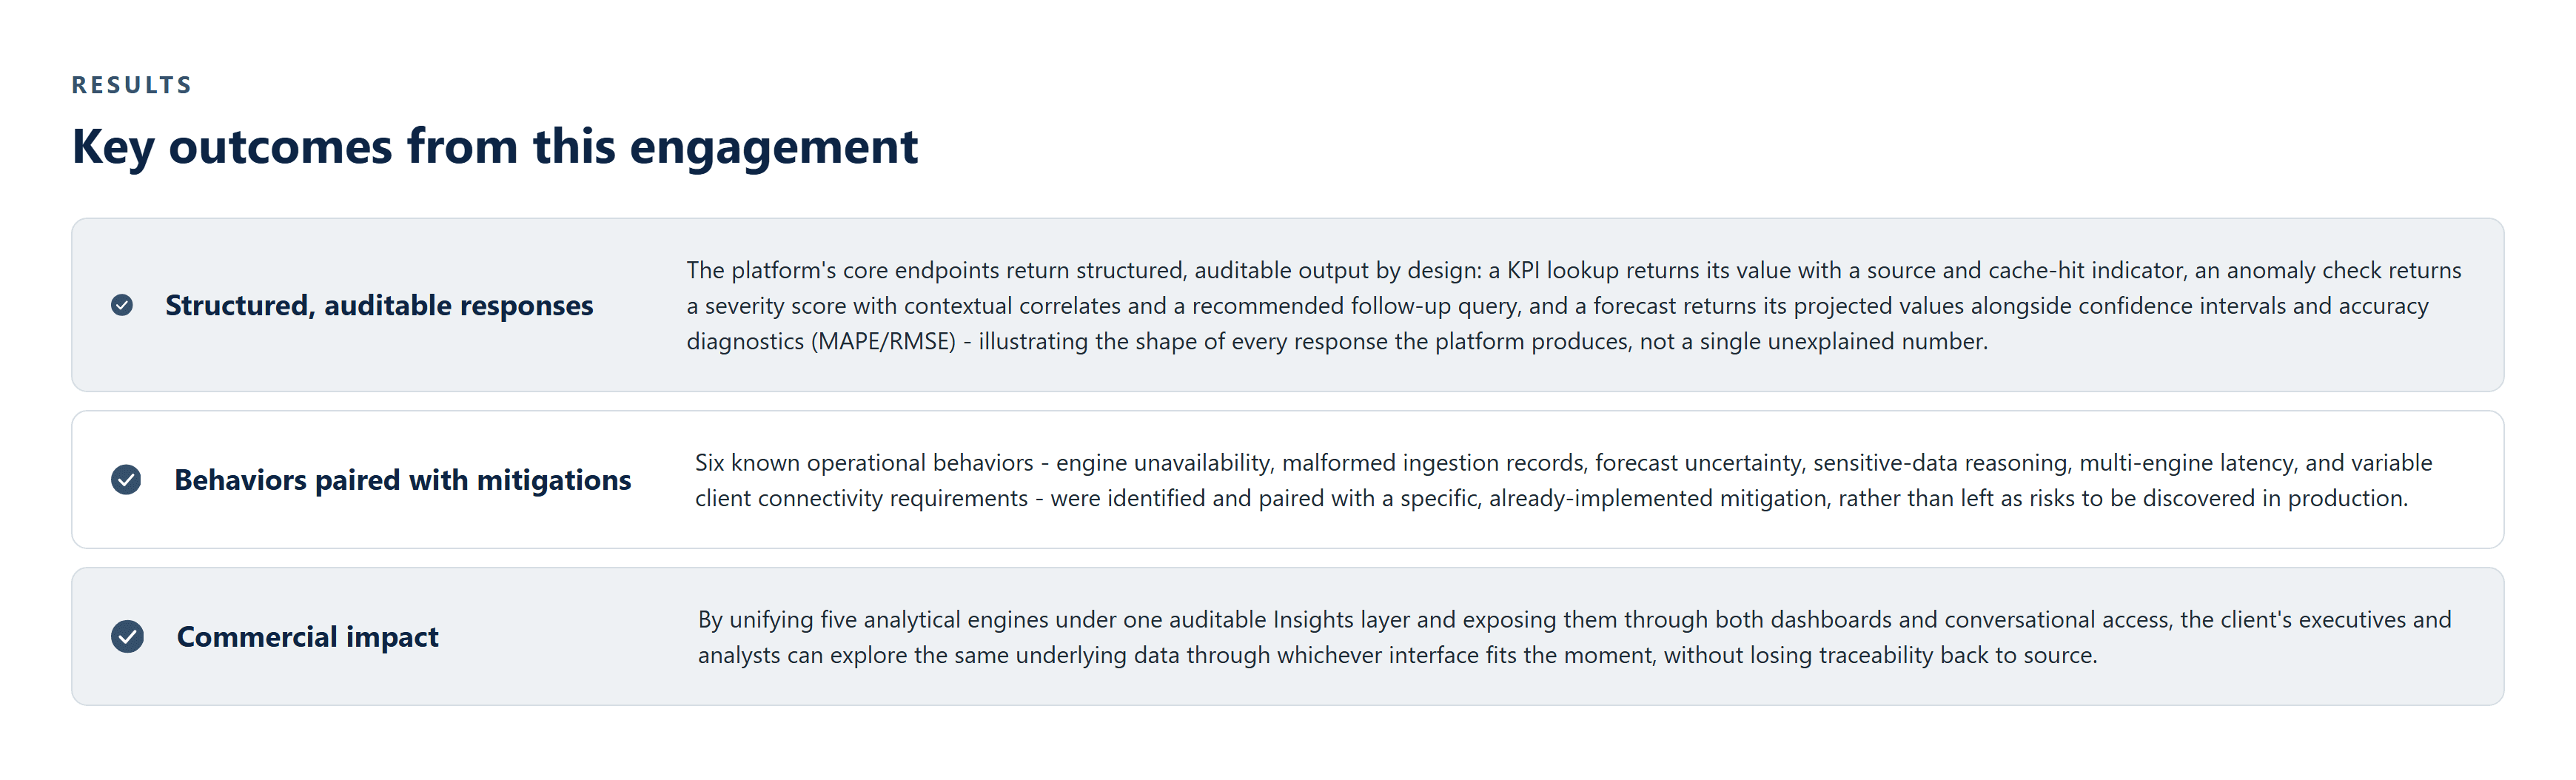
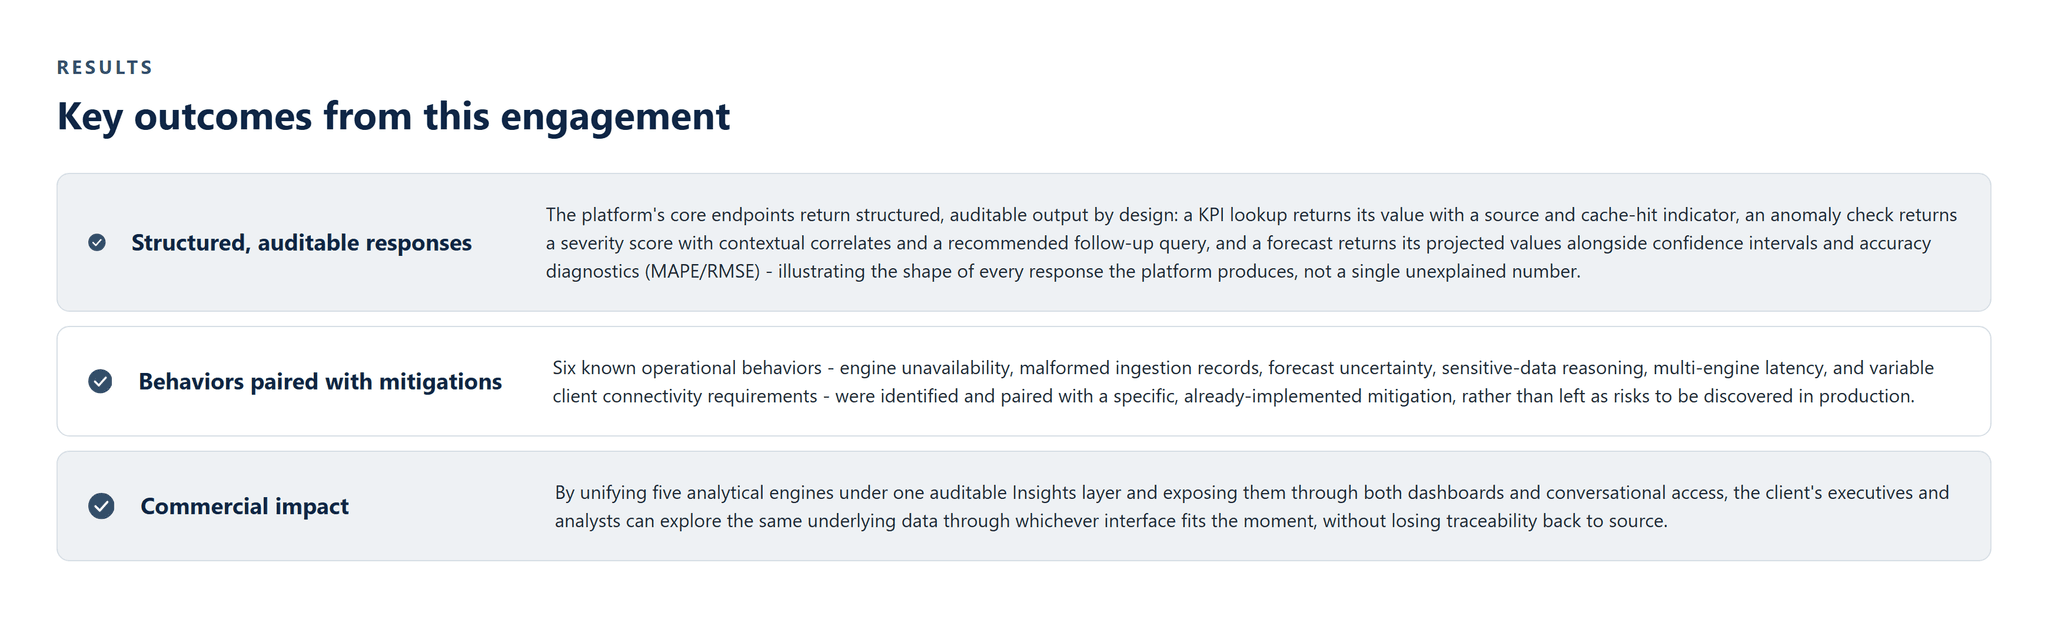
Figure - Key outcomes from this engagement.
The platform's core endpoints return structured, auditable output by design: a KPI lookup returns its value with a source and cache-hit indicator, an anomaly check returns a severity score with contextual correlates and a recommended follow-up query, and a forecast returns its projected values alongside confidence intervals and accuracy diagnostics (MAPE/RMSE) - illustrating the shape of every response the platform produces, not a single unexplained number.
Six known operational behaviors - engine unavailability, malformed ingestion records, forecast uncertainty, sensitive-data reasoning, multi-engine latency, and variable client connectivity requirements - were identified and paired with a specific, already-implemented mitigation, rather than left as risks to be discovered in production.
What it enabled commercially
By unifying five analytical engines under one auditable Insights layer and exposing them through both dashboards and conversational access, the client's executives and analysts can explore the same underlying data through whichever interface fits the moment, without losing traceability back to source.
WHY PFACTORIAL
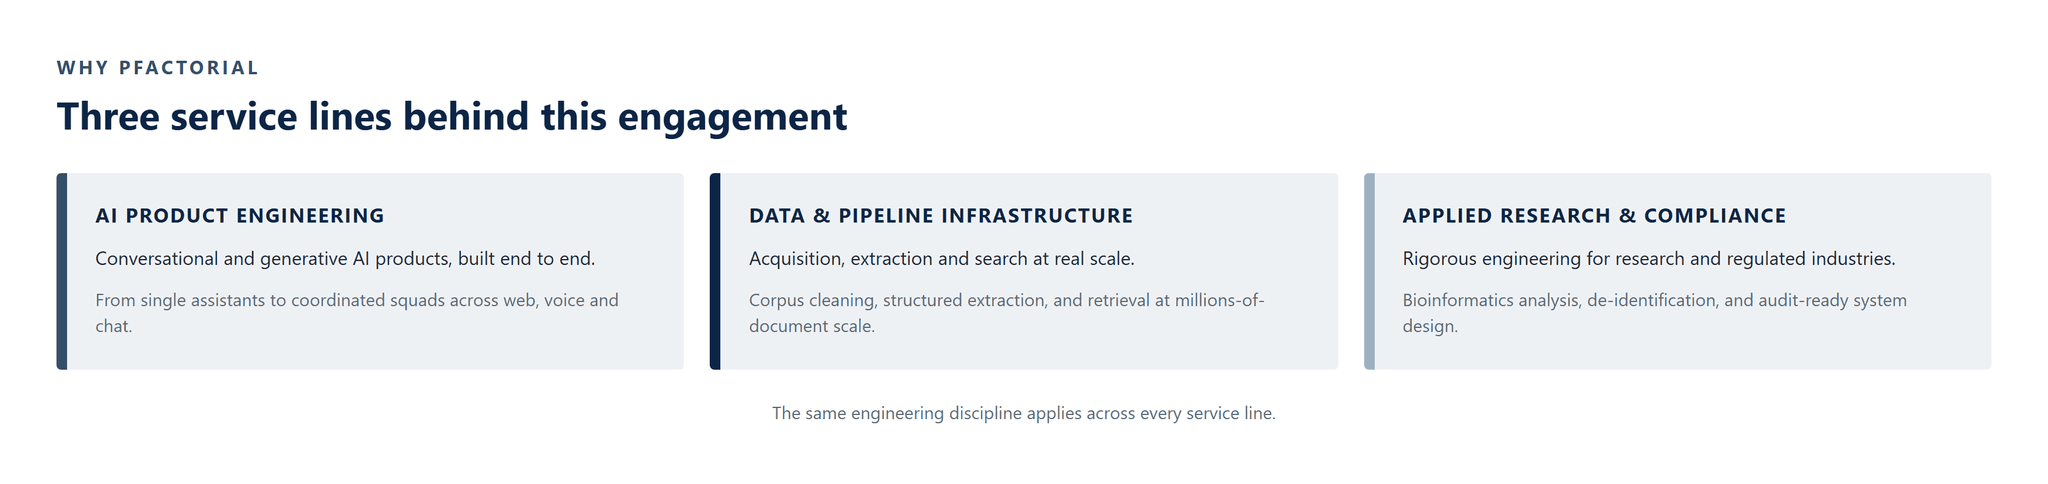
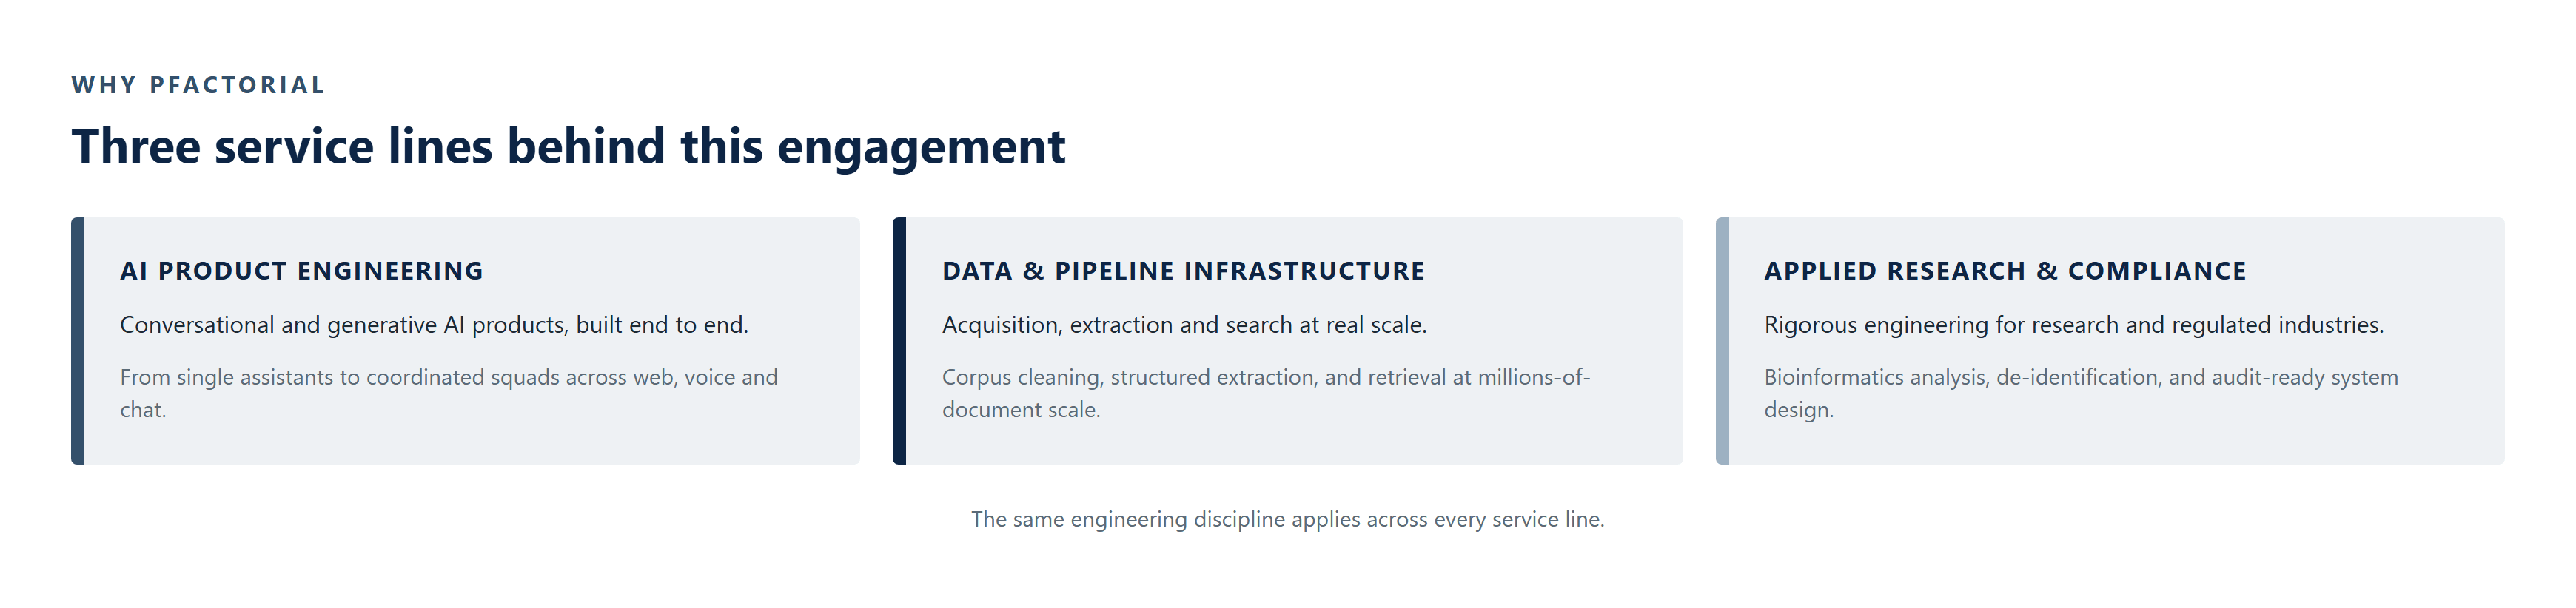
This engagement draws on Pfactorial's data and pipeline infrastructure capability: building enterprise analytics platforms where every KPI, trend, and forecast is traceable to source, and where AI reasoning is deliberately scoped, consented, and auditable rather than opaque.

Figure - Service lines this engagement draws on.
Engagement enquiries Pfactorial Technologies works with organizations whose executive reporting is fragmented across functional systems. If you are evaluating whether a unified analytics platform is worth building properly, we are happy to give you an honest read on scope, cost, and risk before anyone commits to anything. · pfactorial.ai
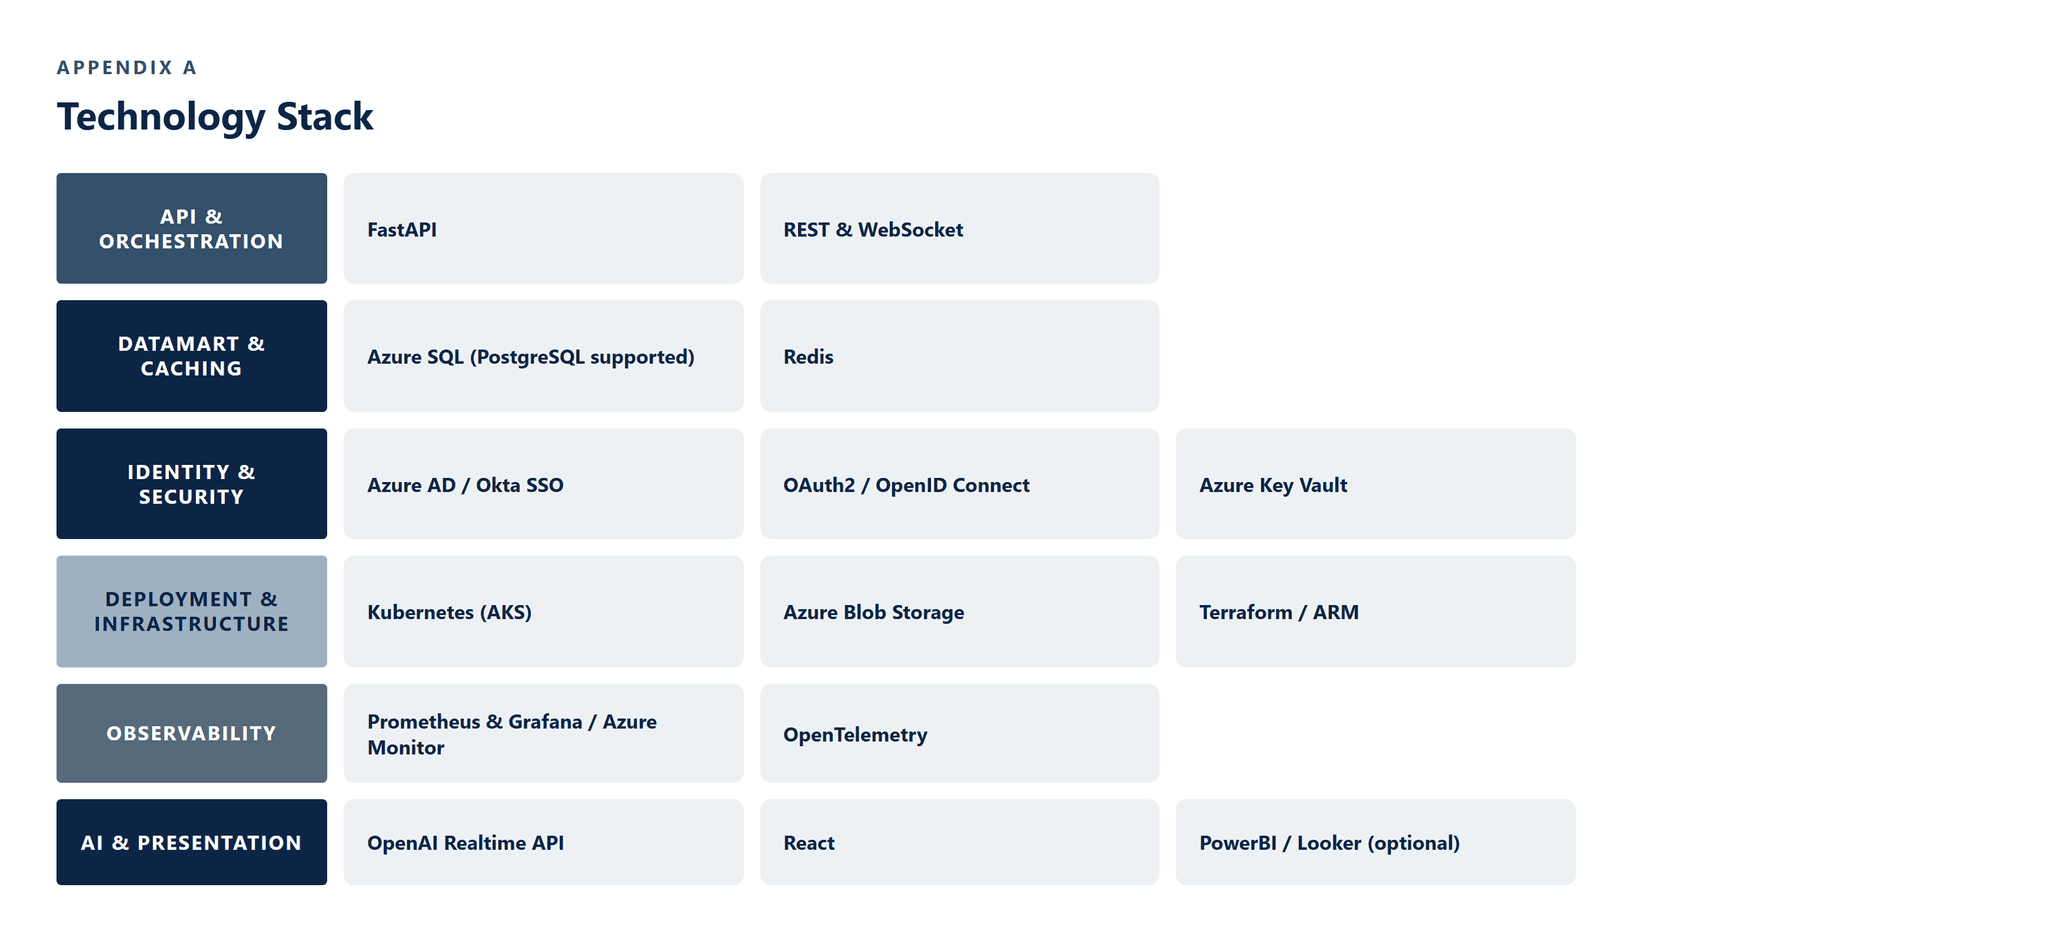
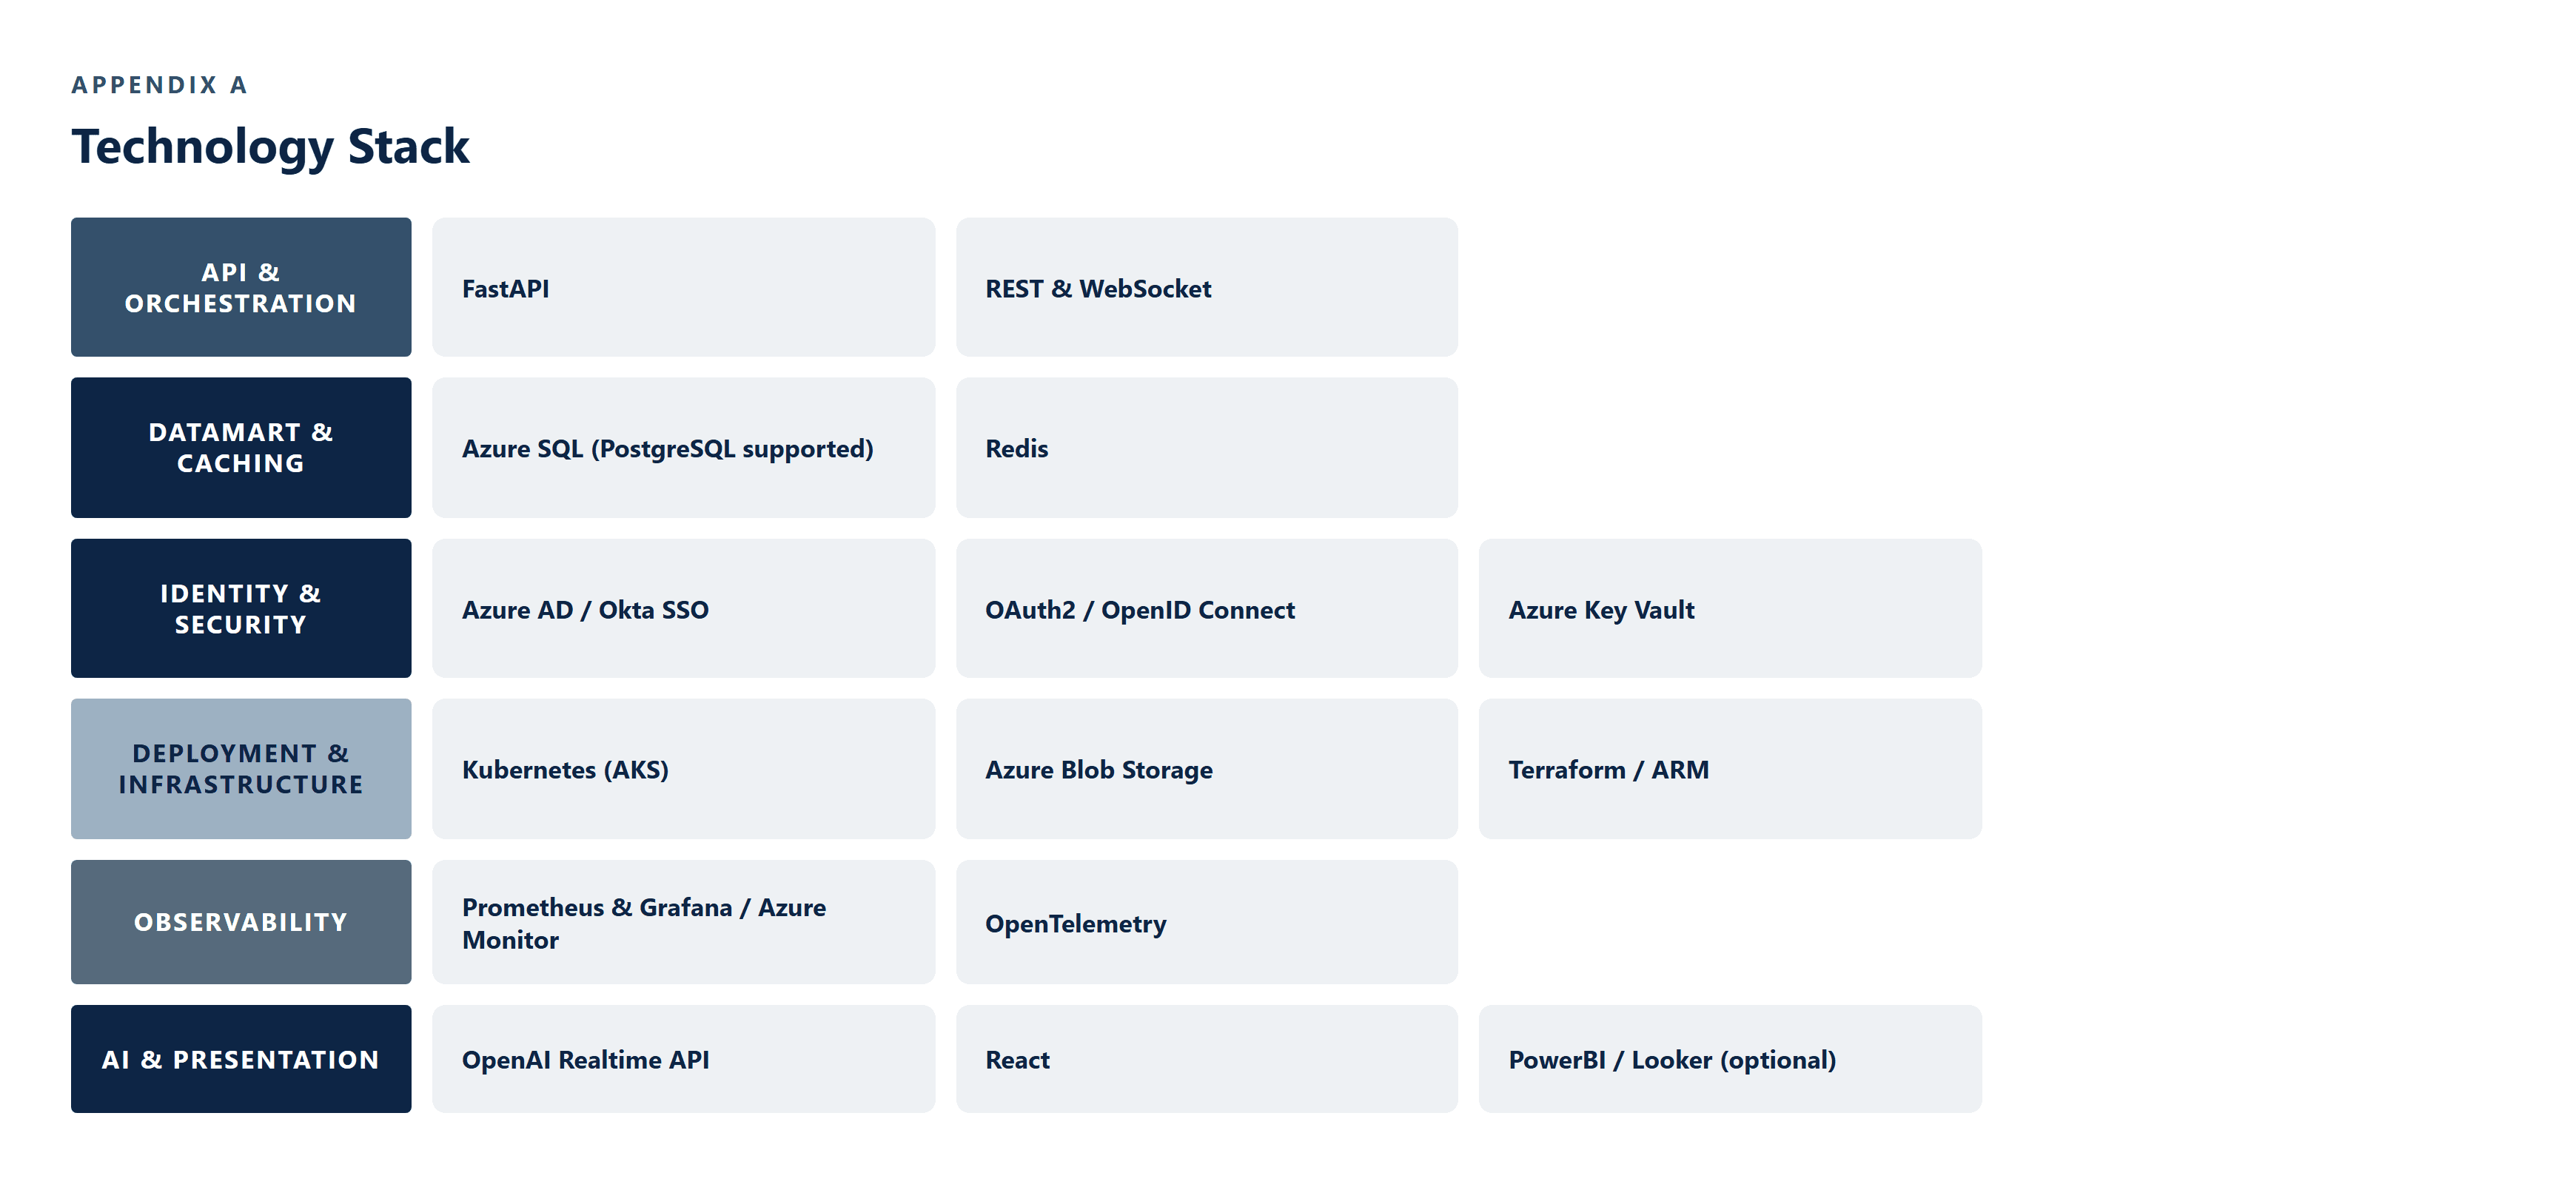
APPENDIX A - TECHNOLOGY STACK
The technology stack underpinning the system, grouped by the layer it serves.

Result and Analysis
ENGAGEMENT SNAPSHOT
An enterprise analytics platform combining a query-optimized datamart with specialized AI insight engines for trends, anomalies, forecasts, and scenario analysis - accessible through dashboards or plain-language conversation.
CASE STUDIES
You might also like...

RAG & Semantic SearchAutomotive & Vehicle
Aug 21, 20267 min readRead

Analytics & BI DashboardsAutomotive & Vehicle
A Five-Capability Computer Vision Platform for Vehicle Identity, Traffic, and Parking Intelligence
Aug 21, 20267 min readRead

A Multi-Perspective AI Response Engine Grounded in Three Religious Texts
Aug 21, 20266 min readRead

Recruiting & HR TechRAG & Semantic Search
A Natural-Language Candidate Search Platform That Replaces Boolean Query Building
Aug 21, 20267 min readRead

OCR & Document ExtractionRAG & Semantic SearchFinance & Payments
A Purpose-Built Search Engine for 1.6 Million SEC & SEDAR Agreements
Aug 21, 20267 min readRead

Conversational AI & ChatbotsRAG & Semantic Search
A Retrieval-Augmented Chat Interface Over Structured Tax Records
Aug 21, 20267 min readRead