Back
Analytics & BI Dashboards
A Self-Service Anomaly Detection Platform Spanning Statistical and Machine-Learning Methods
How Pfactorial Technologies built Outliverse, a single-page application that lets a user detect anomalies in numerical datasets using statistical thresholds or unsupervised machine learning, without writing code.
August 21, 2026
Share
ENGAGEMENT SNAPSHOT

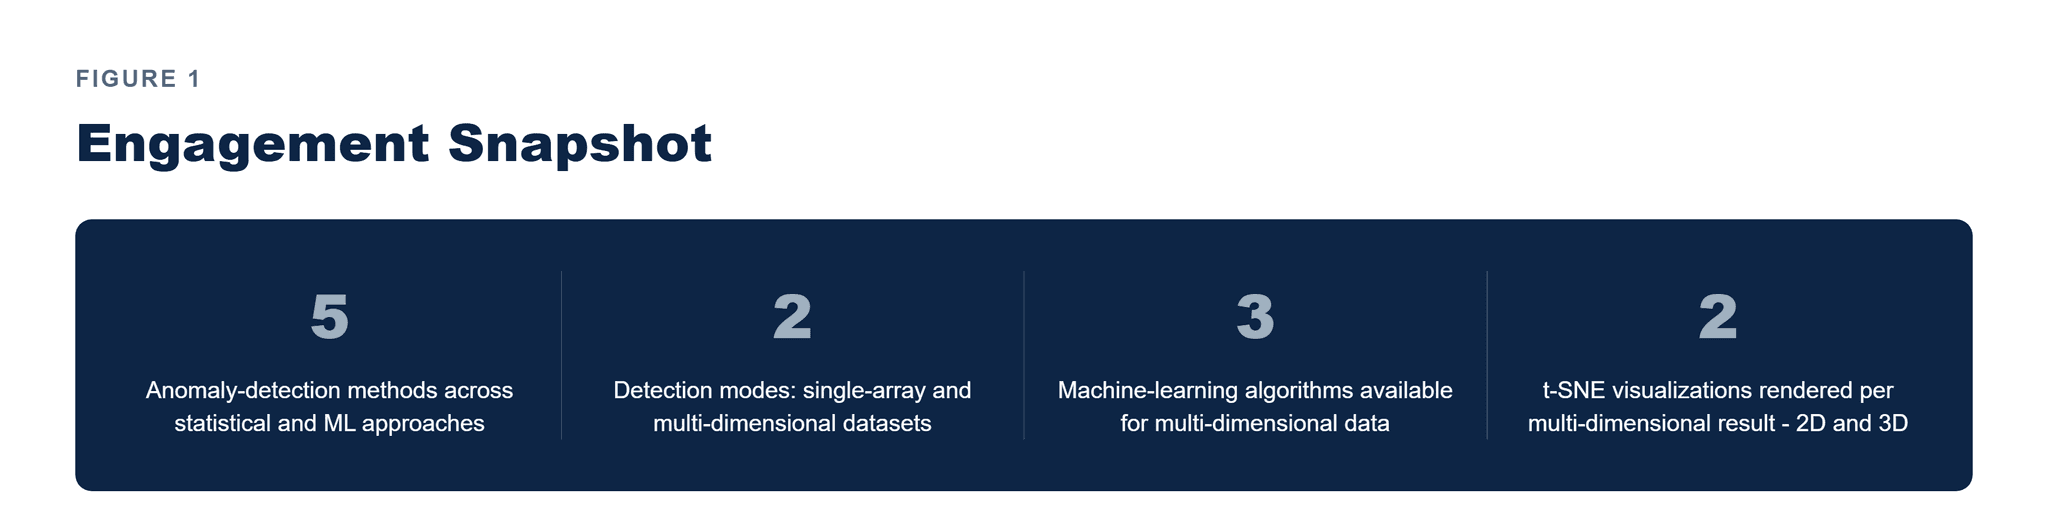
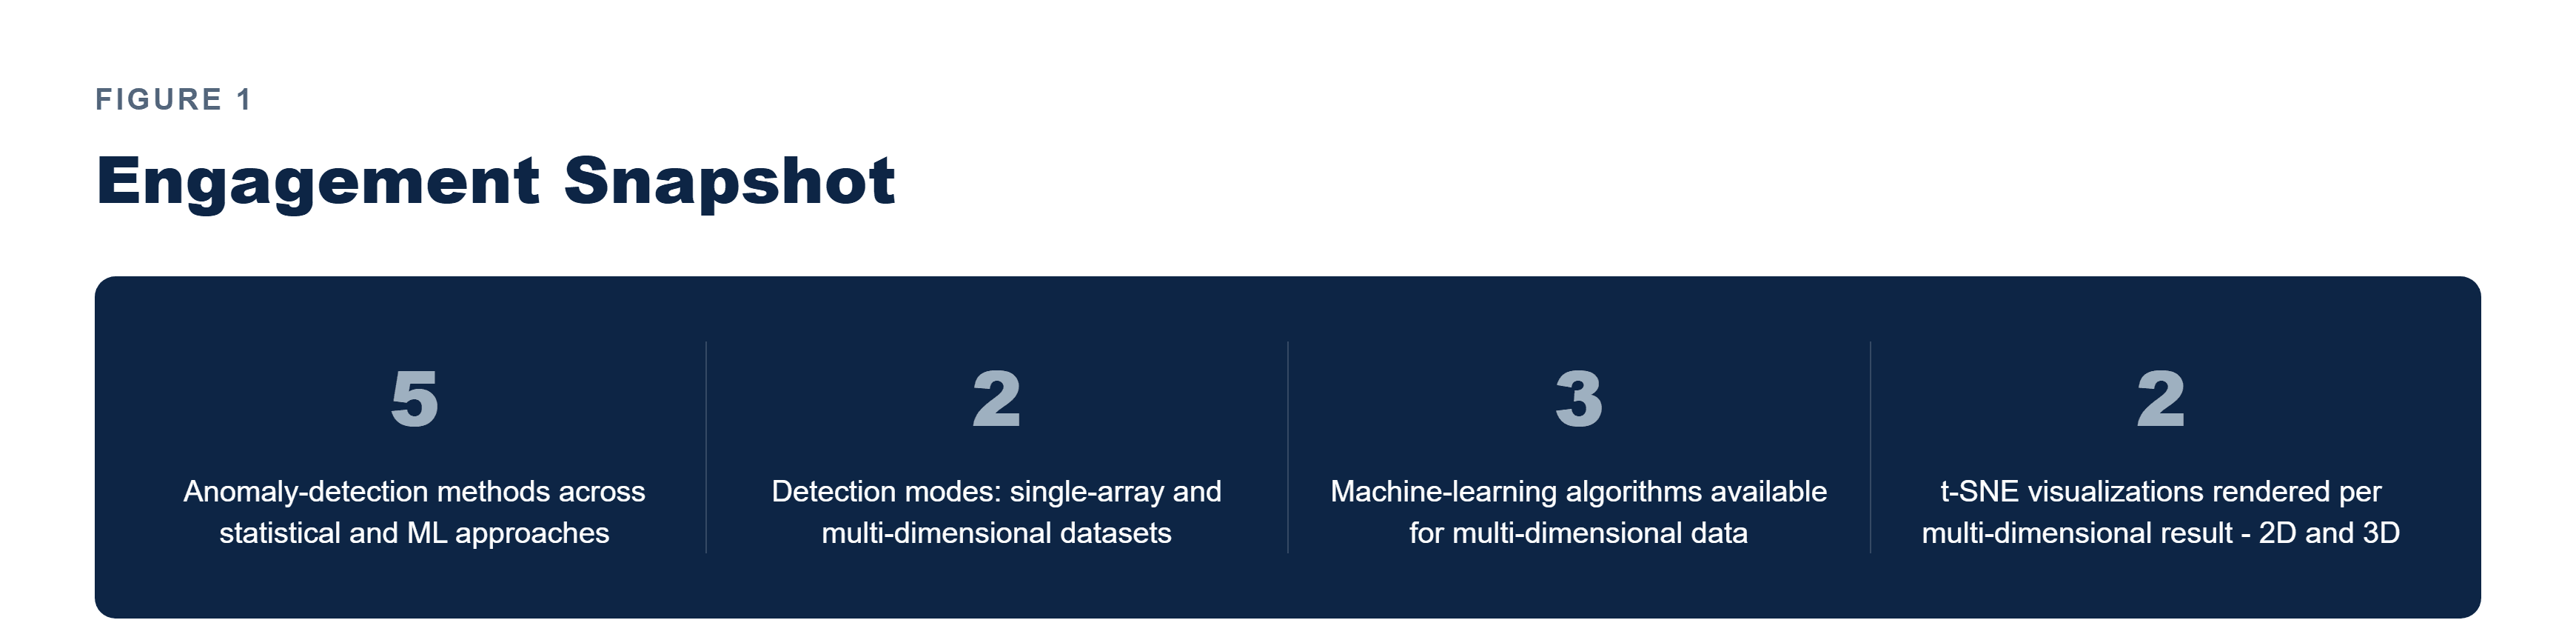
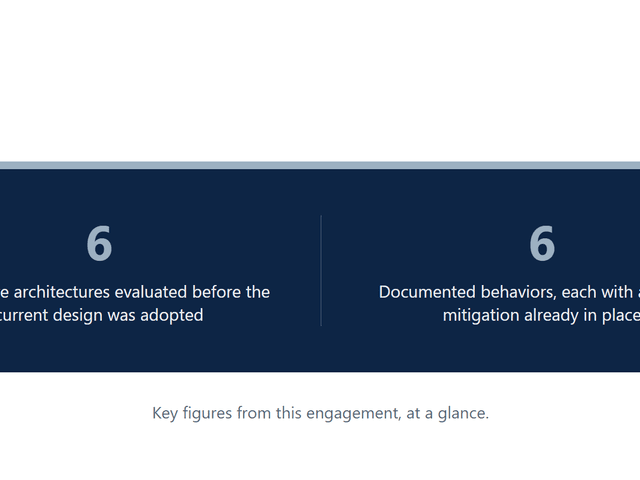
Figure 1 - Key figures from this engagement, at a glance.
EXECUTIVE SUMMARY
Our client needed a way for non-specialist users to find anomalies in numerical datasets - a single array of values or a full table of numerical columns - without each analyst writing their own statistical or machine-learning code from scratch every time.
A single detection method isn't enough: a plain standard-deviation threshold works for a simple, roughly normal array but says nothing about a multi-column dataset where the anomaly is a combination of values across columns, which needs an unsupervised learning approach and a way to actually see the result, not just a flagged row.
Pfactorial built Outliverse, a single-page anomaly detection application built around the pycaret package, that lets a user choose statistical or machine-learning detection depending on whether they're working with one column or many, and returns both the flagged anomalies and a visual representation of them.
Why this engagement is representative This engagement demonstrates Pfactorial's approach to making a real analytical capability - anomaly detection spanning classical statistics and unsupervised ML - usable by someone who isn't going to write the underlying code themselves.
THE CHALLENGE
Making anomaly detection genuinely self-service meant solving problems that a single fixed method can't cover.
1. One detection method doesn't fit every dataset shape
A single numerical array calls for a simple statistical threshold, while a table of numerical columns needs a method that can reason about relationships between columns - one method can't serve both.
2. A flagged anomaly without a way to see it isn't actionable
A list of anomalous row indices means little on its own; a user needs a visual representation to understand where an anomaly sits relative to the rest of the data.
3. High-dimensional anomalies aren't visible in a 2D plot alone
Anomalies detected across multiple columns need a dimensionality-reduction technique to become visually interpretable at all, and a single 2D projection can still hide structure a 3D one reveals.
The real brief Not "flag anomalous rows" but "let the user pick the detection method that matches their data's shape, and show them the anomaly, not just report it."
THE SOLUTION
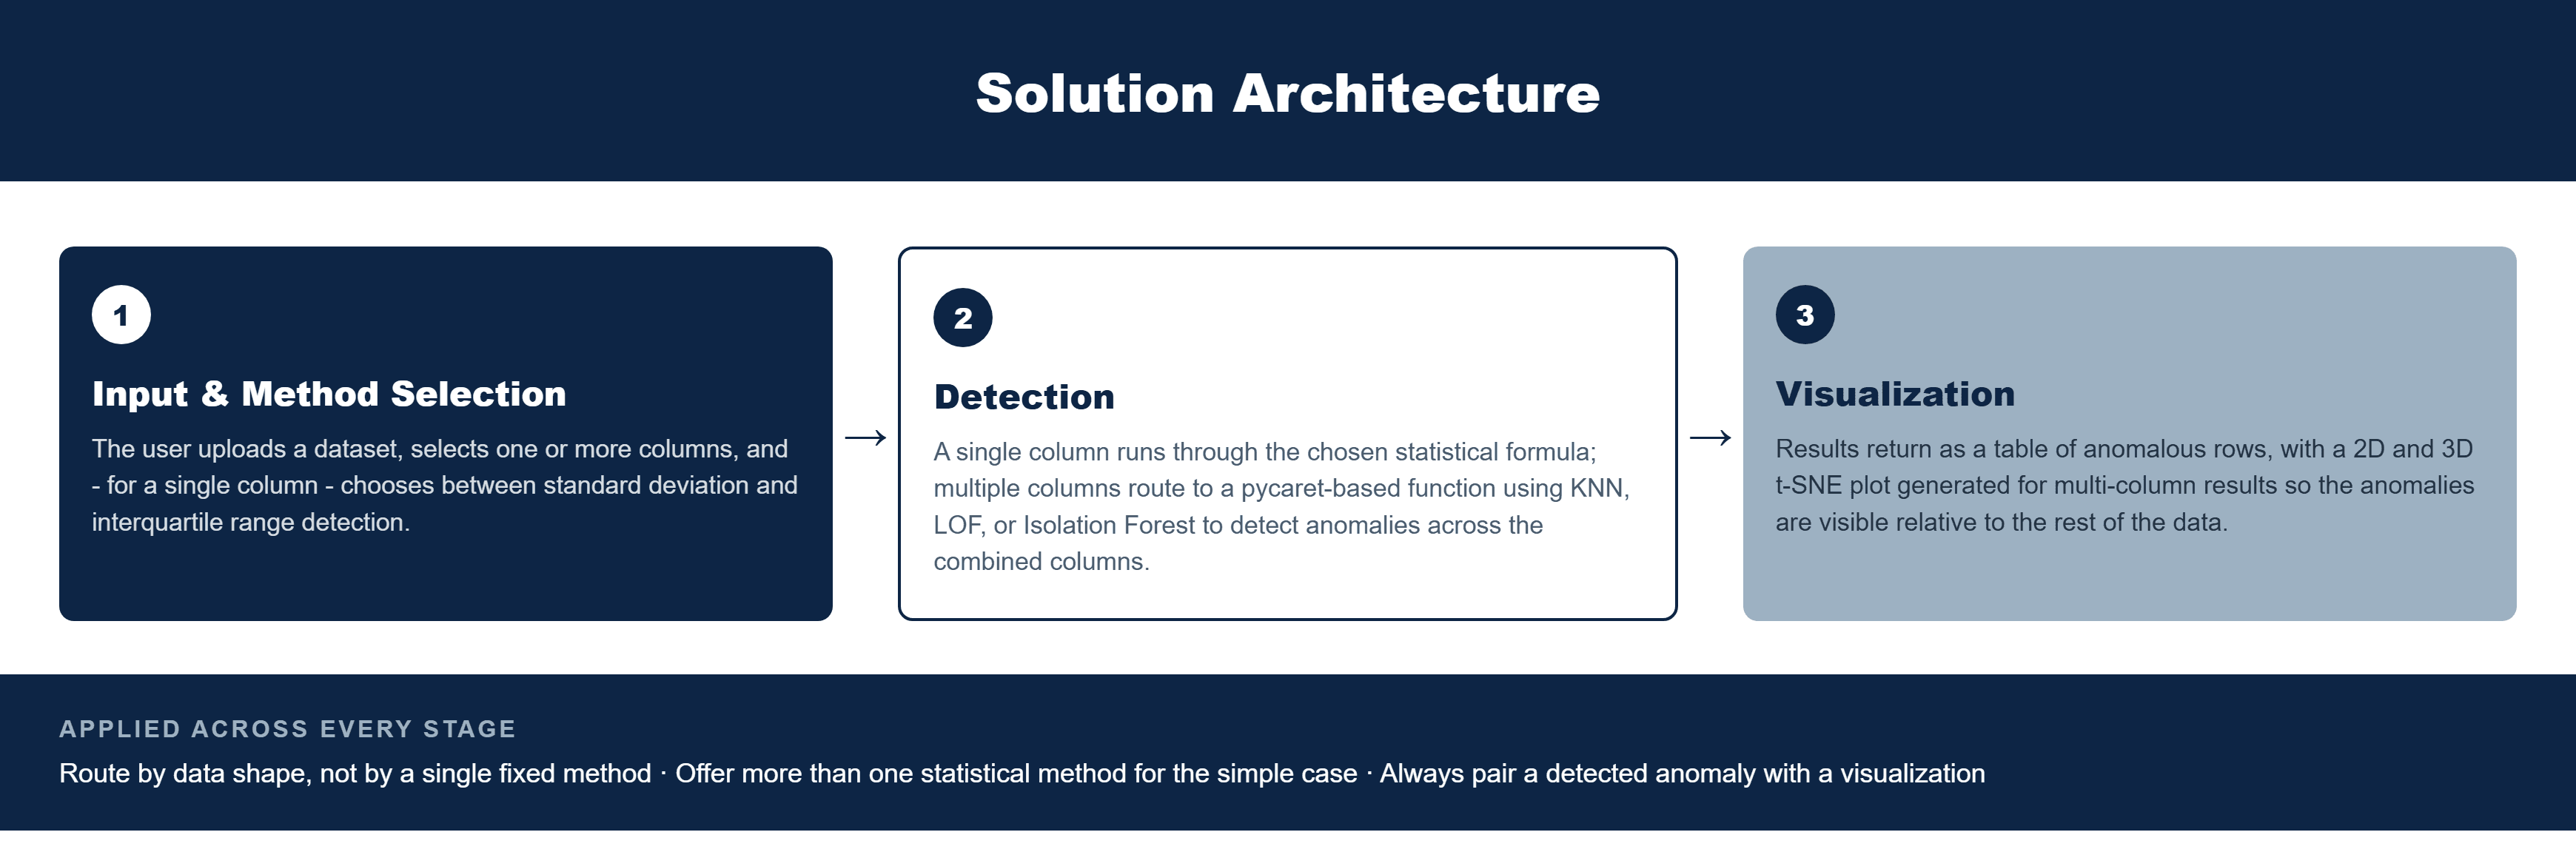
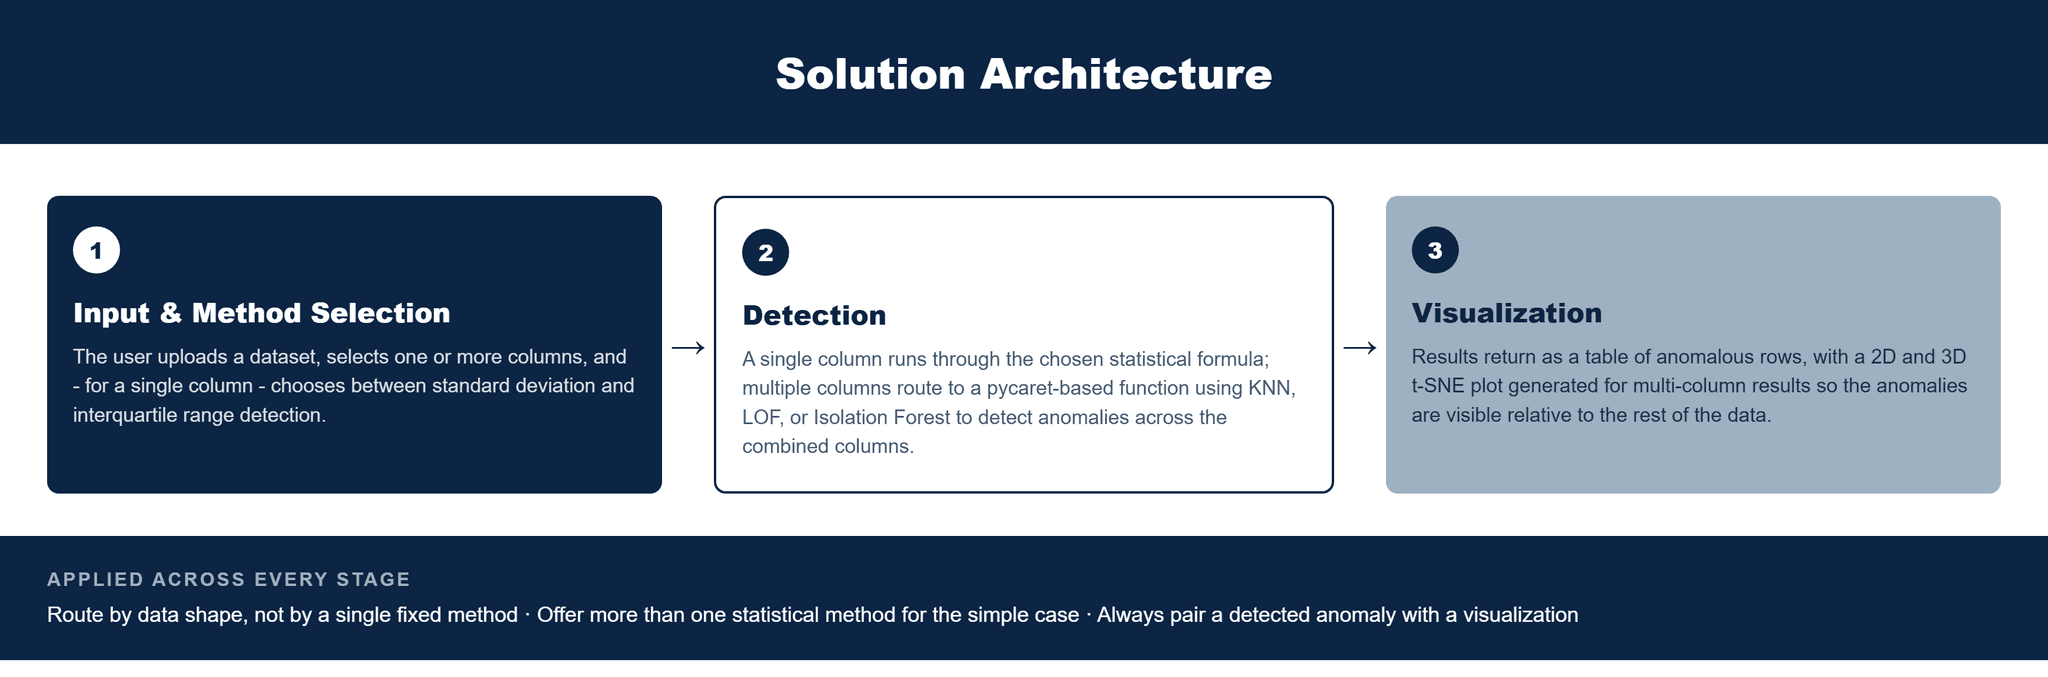
Pfactorial built Outliverse around a Flask backend, a pycaret-based detection backbone, and a routing decision made purely on how many columns the user selects.

Figure 1 - The number of columns selected determines the detection method; every multi-column result is paired with a visualization.
Architectural principles
- Route by data shape, not by a single fixed method - The app decides between statistical and machine-learning detection automatically based on whether the user selected one column or several, rather than forcing one method to handle every case.
- Offer more than one statistical method for the simple case - Standard deviation and interquartile range are both available for single-column detection, because they make different assumptions about the data's distribution and neither is right for every array.
- Always pair a detected anomaly with a visualization - Every result includes a graphical representation - 2D and 3D t-SNE projections for multi-column detection - so an anomaly is something a user can see, not just a row number in a table.
CAPABILITIES DELIVERED
Each capability covers one part of the path from a raw dataset to a visible, explained anomaly.
CAPABILITY | WHAT IT DOES |
|---|---|
Single-array anomaly detection | Detects outliers in one numerical column using standard deviation (mean ± 3 std) or interquartile range (1.5x IQR beyond Q1/Q3). |
Multi-dimensional anomaly detection | Detects anomalies across multiple numerical columns using pycaret-backed KNN, Local Outlier Factor, or Isolation Forest. |
t-SNE visualization | Renders 2D and 3D t-SNE cluster plots for multi-column results, making high-dimensional anomalies visually interpretable. |
Column-driven method selection UI | A simple form lets the user choose which columns to include and which method to apply, without writing any analysis code. |
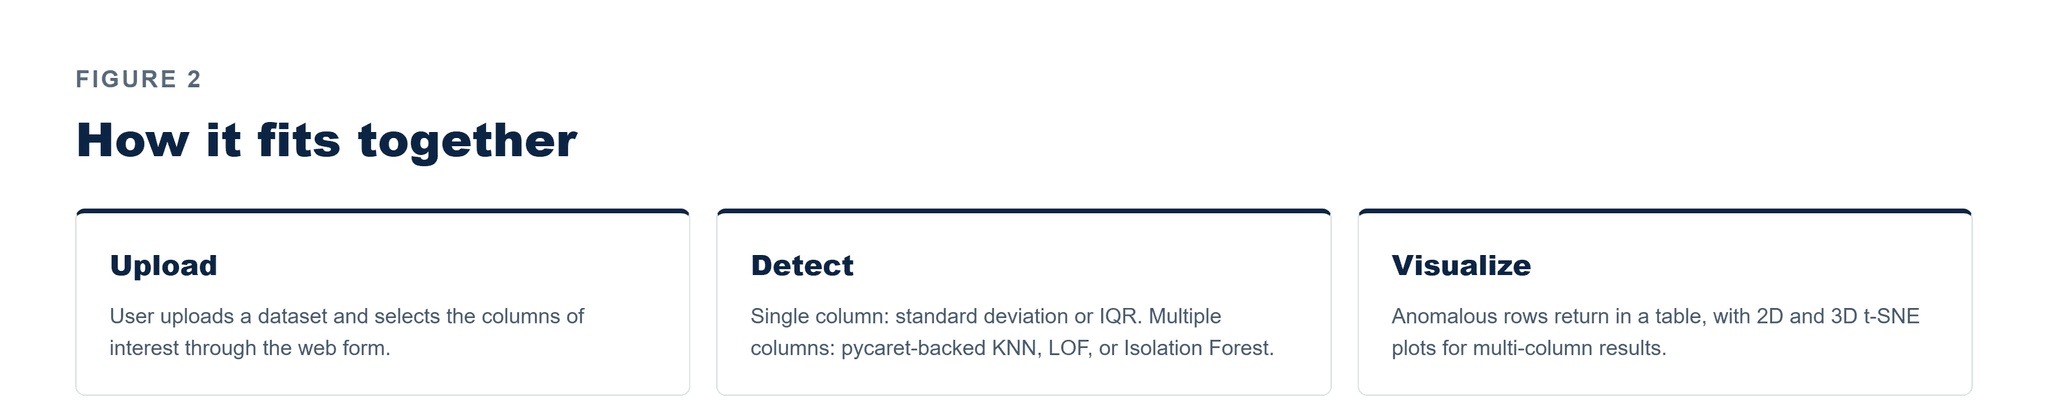
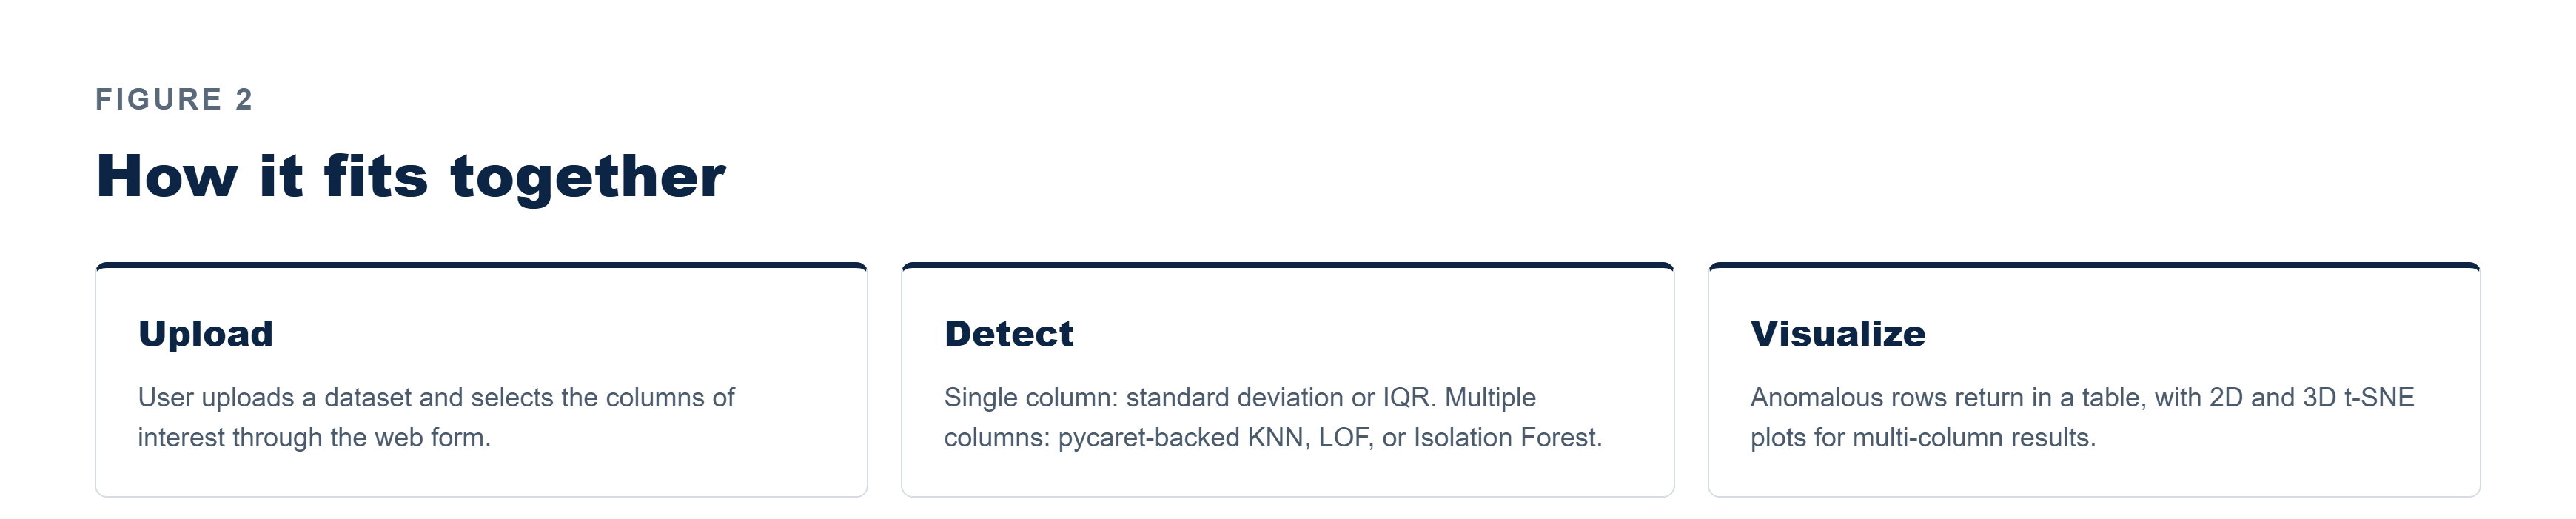
Figure 2 - From a raw dataset to a visualized anomaly, routed automatically by data shape.
Design note Outliverse deliberately keeps the single-array methods purely statistical rather than routing everything through machine learning - a plain standard-deviation or IQR threshold is faster, more transparent, and entirely sufficient when there's only one column to reason about.
ENGINEERING FOR SCALE AND RELIABILITY
Three decisions kept the tool simple to run and easy to reason about despite spanning two different classes of detection method.
pycaret as the machine-learning backbone
Rather than hand-implementing KNN, LOF, and Isolation Forest separately, the multi-column path is built on pycaret's anomaly-detection module, which provides a consistent interface across all three algorithms.
Flask as the sole connective layer
Flask sits between the HTML form and the detection backbone with no additional service layer, keeping the deployment footprint to one process on one port.
Deterministic formulas kept separate from the ML path entirely
Standard deviation and IQR detection run as plain Python functions with no model involved, so the single-column path stays fast, reproducible, and easy to audit independently of the ML path.
DELIVERY APPROACH
The application was built outward from the two detection paths, then wired to a shared upload-and-results interface.
1. Statistical detection functions - implementing standard deviation and interquartile range detection for single-array inputs.
2. ML detection integration - wiring the multi-column path to pycaret's anomaly module for KNN, LOF, and Isolation Forest detection.
3. Visualization layer - adding 2D and 3D t-SNE plot generation for multi-column results.
4. Frontend & deployment - building the HTML/CSS upload-and-column-selection interface and deploying the Flask app on its own port.
RESULTS AND IMPACT

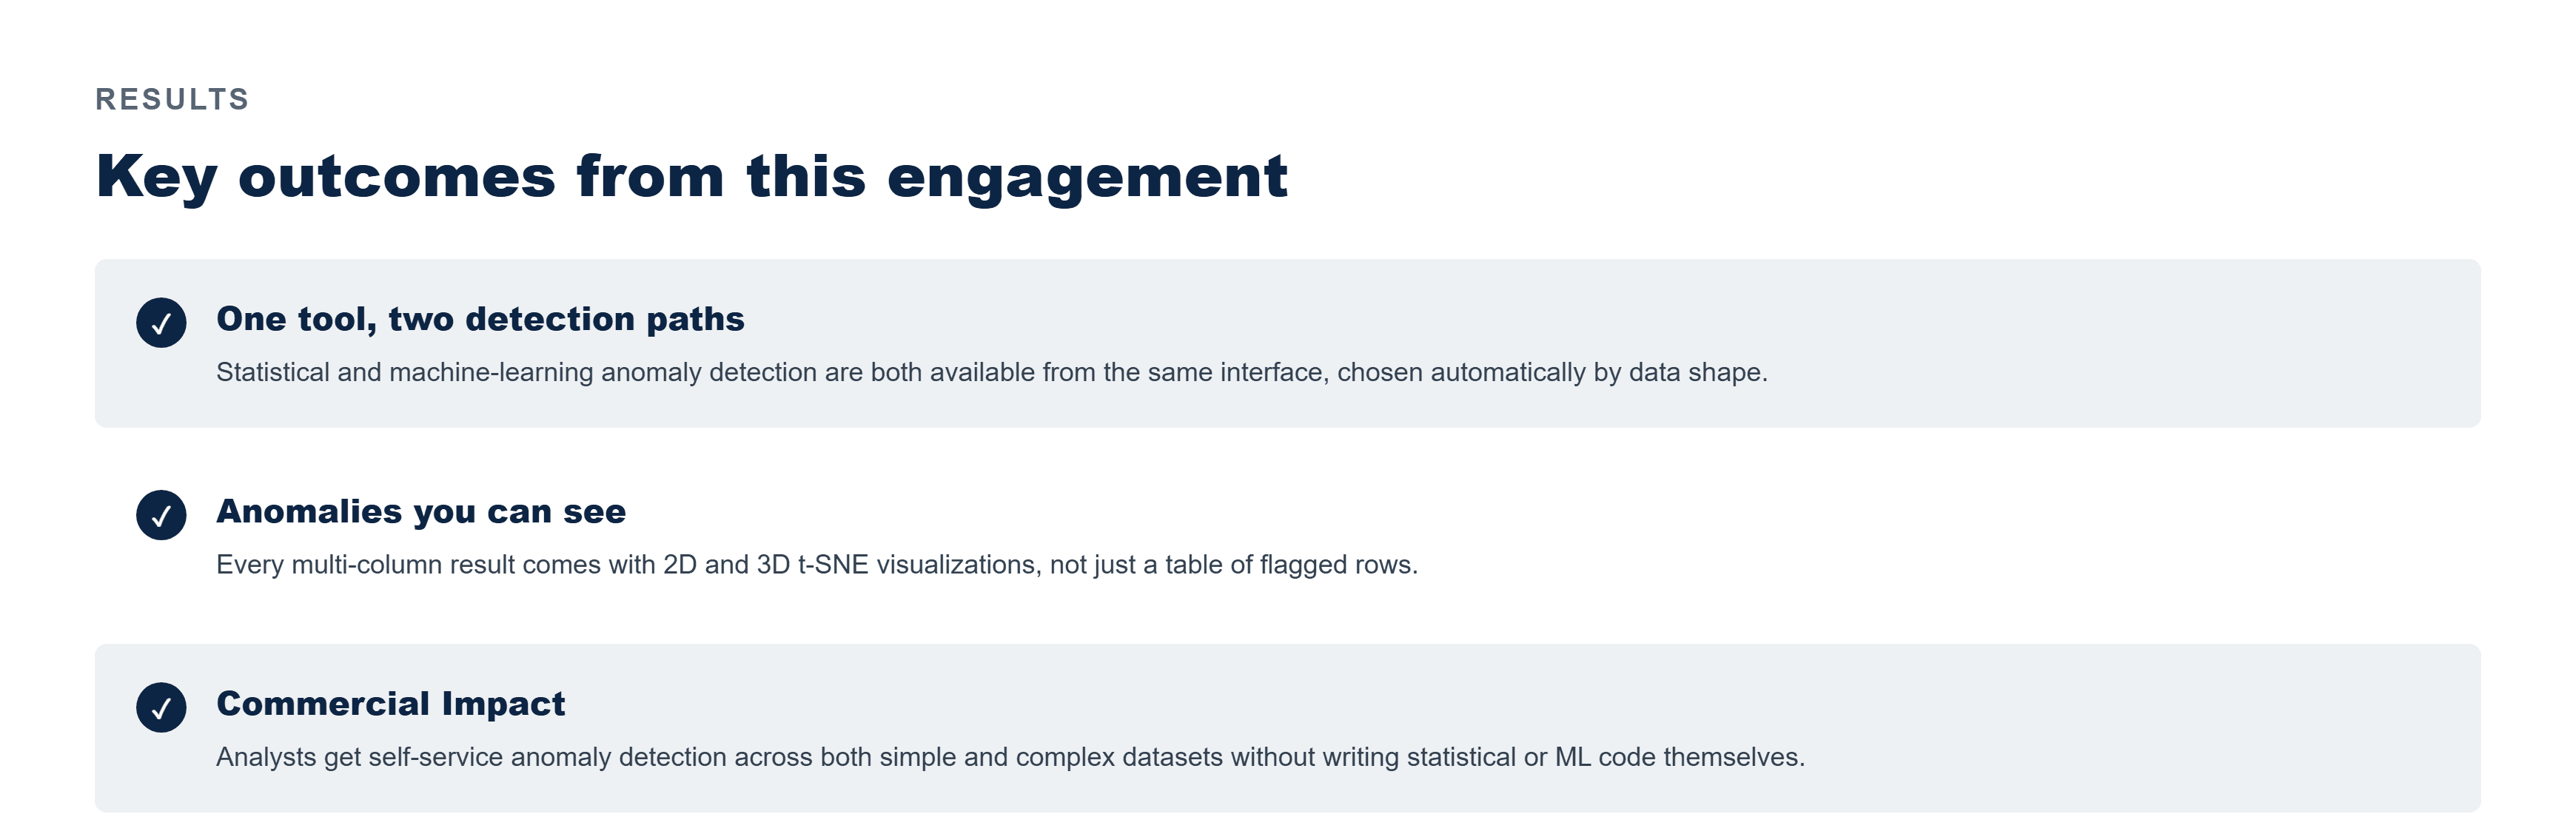
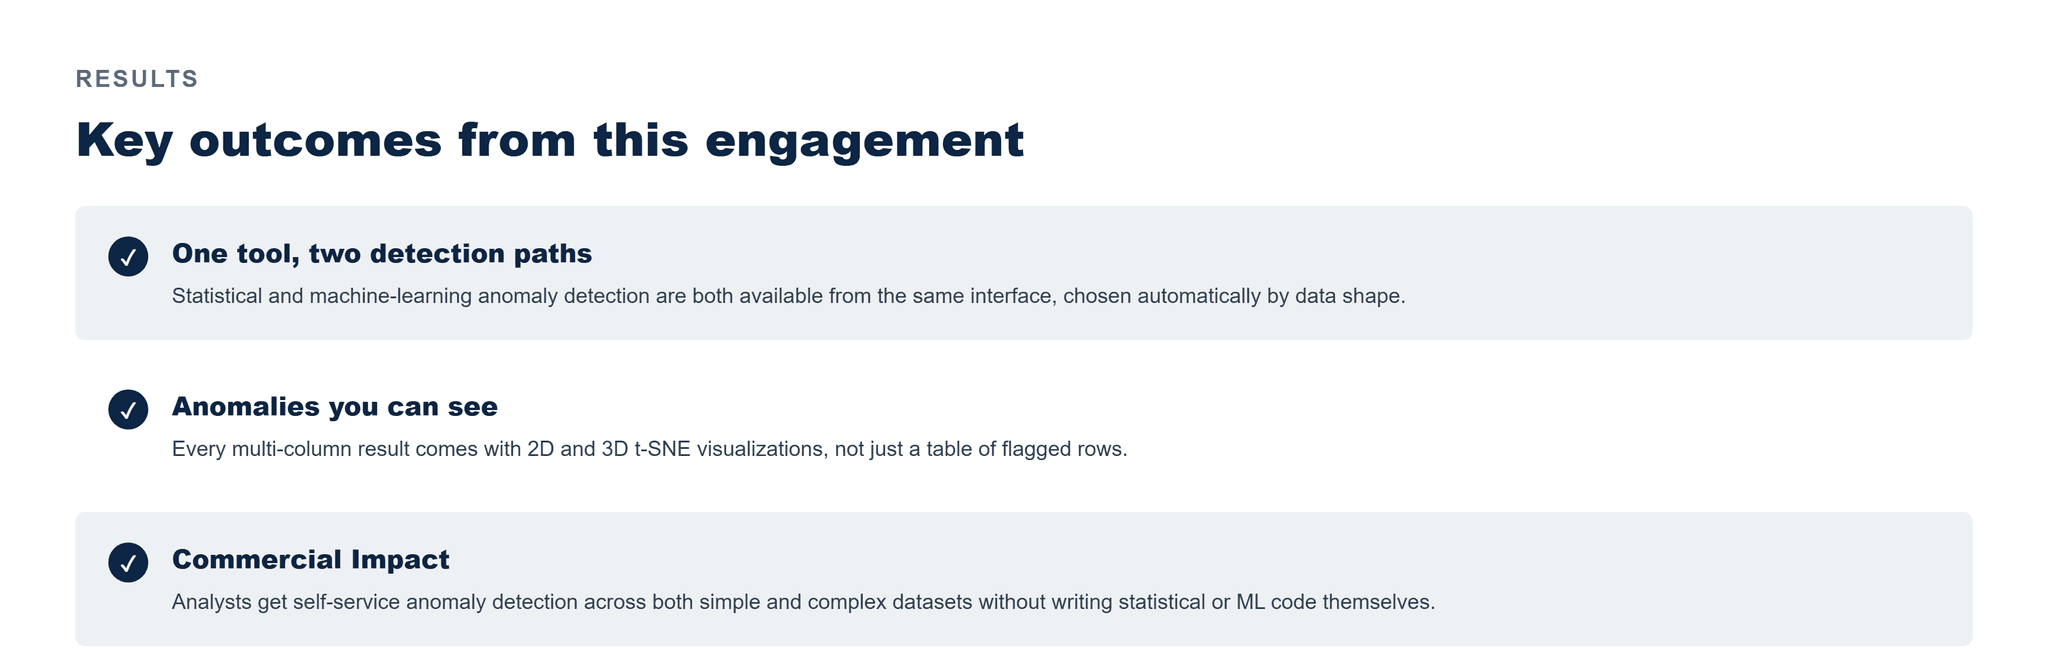
- Key outcomes from this engagement.
Outliverse is built and deployed as a single-page application, giving users a working choice between statistical and machine-learning anomaly detection depending on whether they're working with one column or many.
Because every multi-column result includes a 2D and 3D t-SNE visualization alongside the flagged anomalies, users can interpret a detected anomaly visually rather than relying on a row index and a number alone.
What it enabled commercially
Analysts and non-specialist users can now run anomaly detection against their own numerical datasets - from a single measurement series to a full multi-column table - without writing statistical or machine-learning code, using whichever method matches the shape of the data they have.
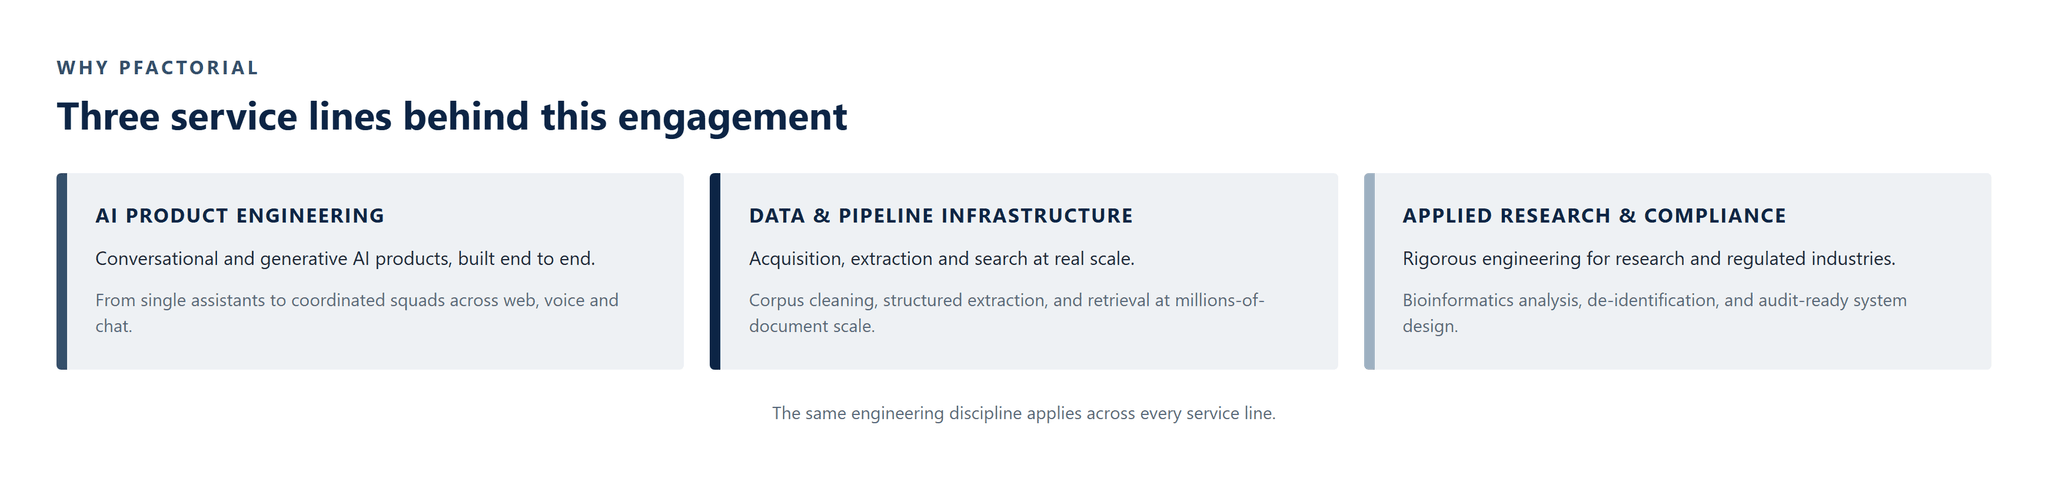
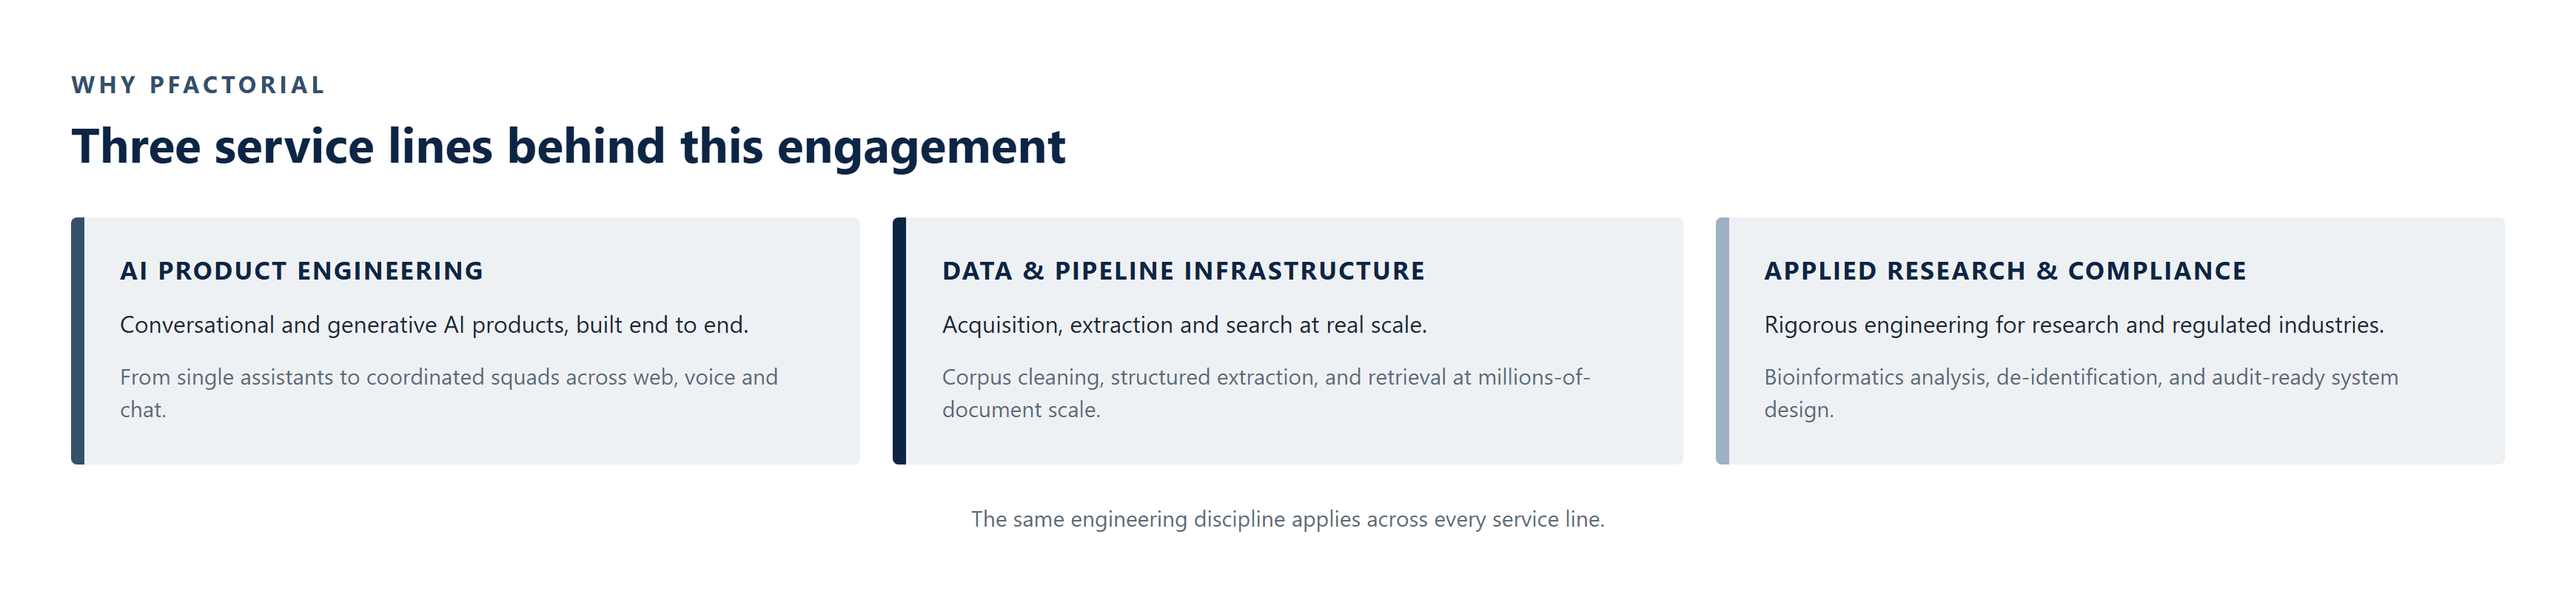
WHY PFACTORIAL
This engagement reflects Pfactorial's approach to packaging a real analytical capability - spanning classical statistics and unsupervised machine learning - into a tool a non-specialist can actually use, with visualization treated as part of the result, not an afterthought.

- Service lines this engagement draws on.
Engagement enquiries Pfactorial Technologies works with organisations that need analytical capabilities - anomaly detection, statistical tooling, self-service data exploration - turned into something a non-specialist user can run without writing code. If you're evaluating a self-service analytics tool, we're happy to give you an honest read on scope and risk before anyone commits to anything. · pfactorial.ai
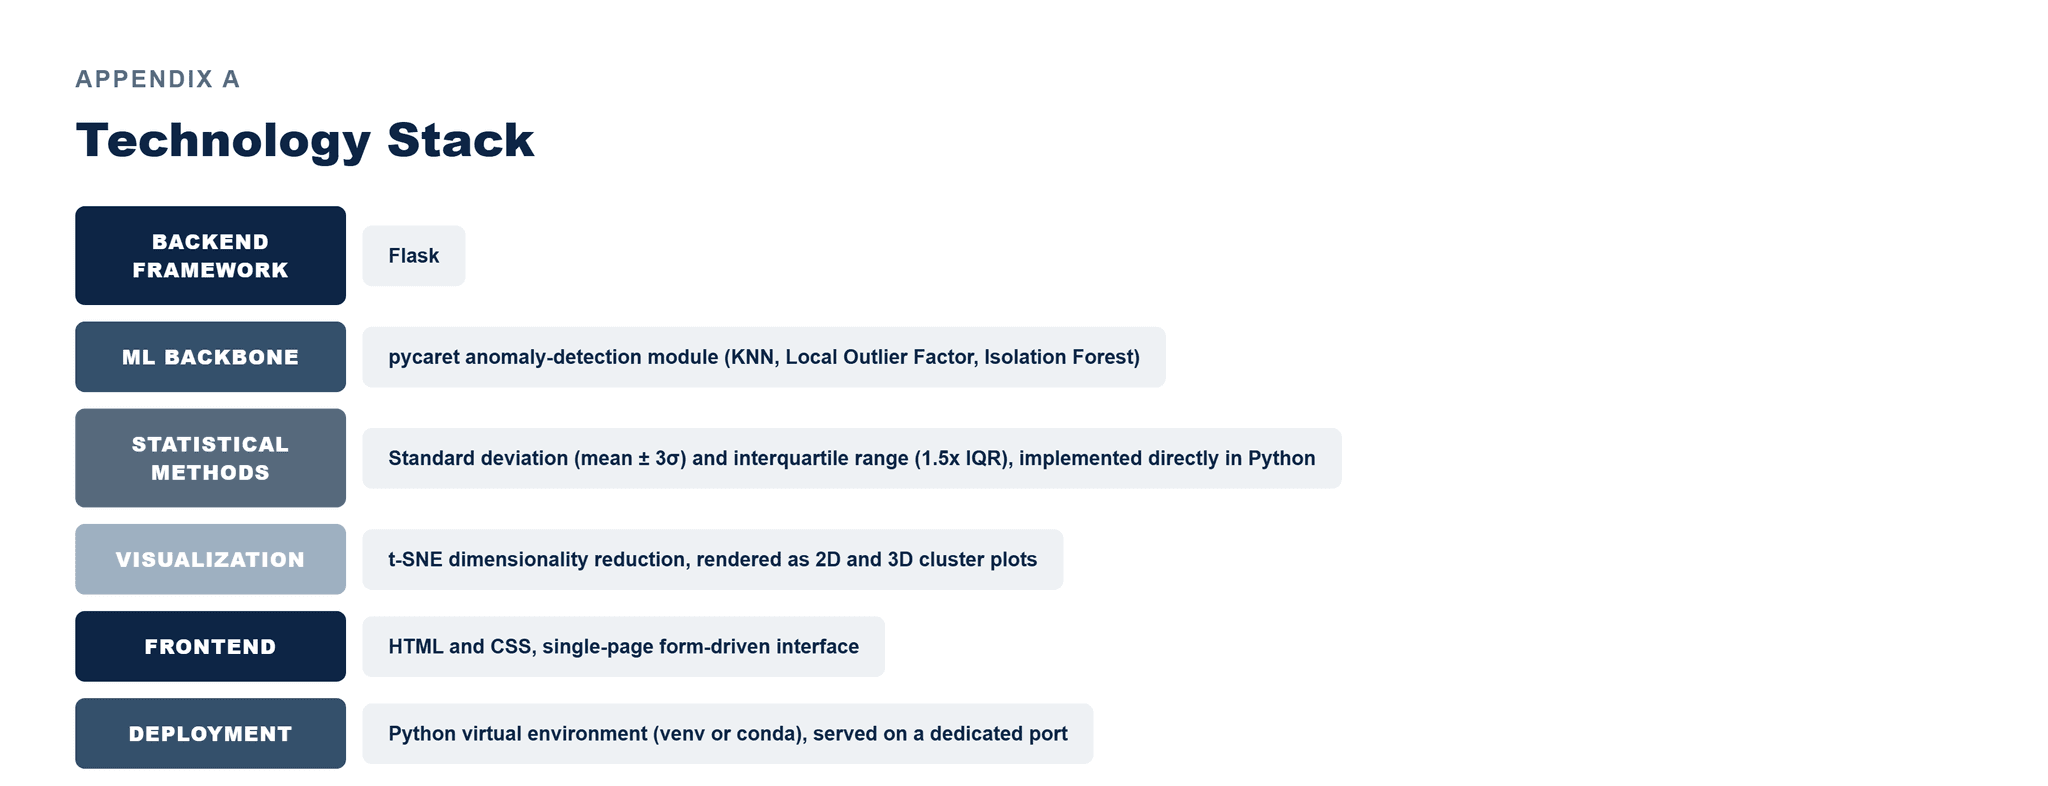
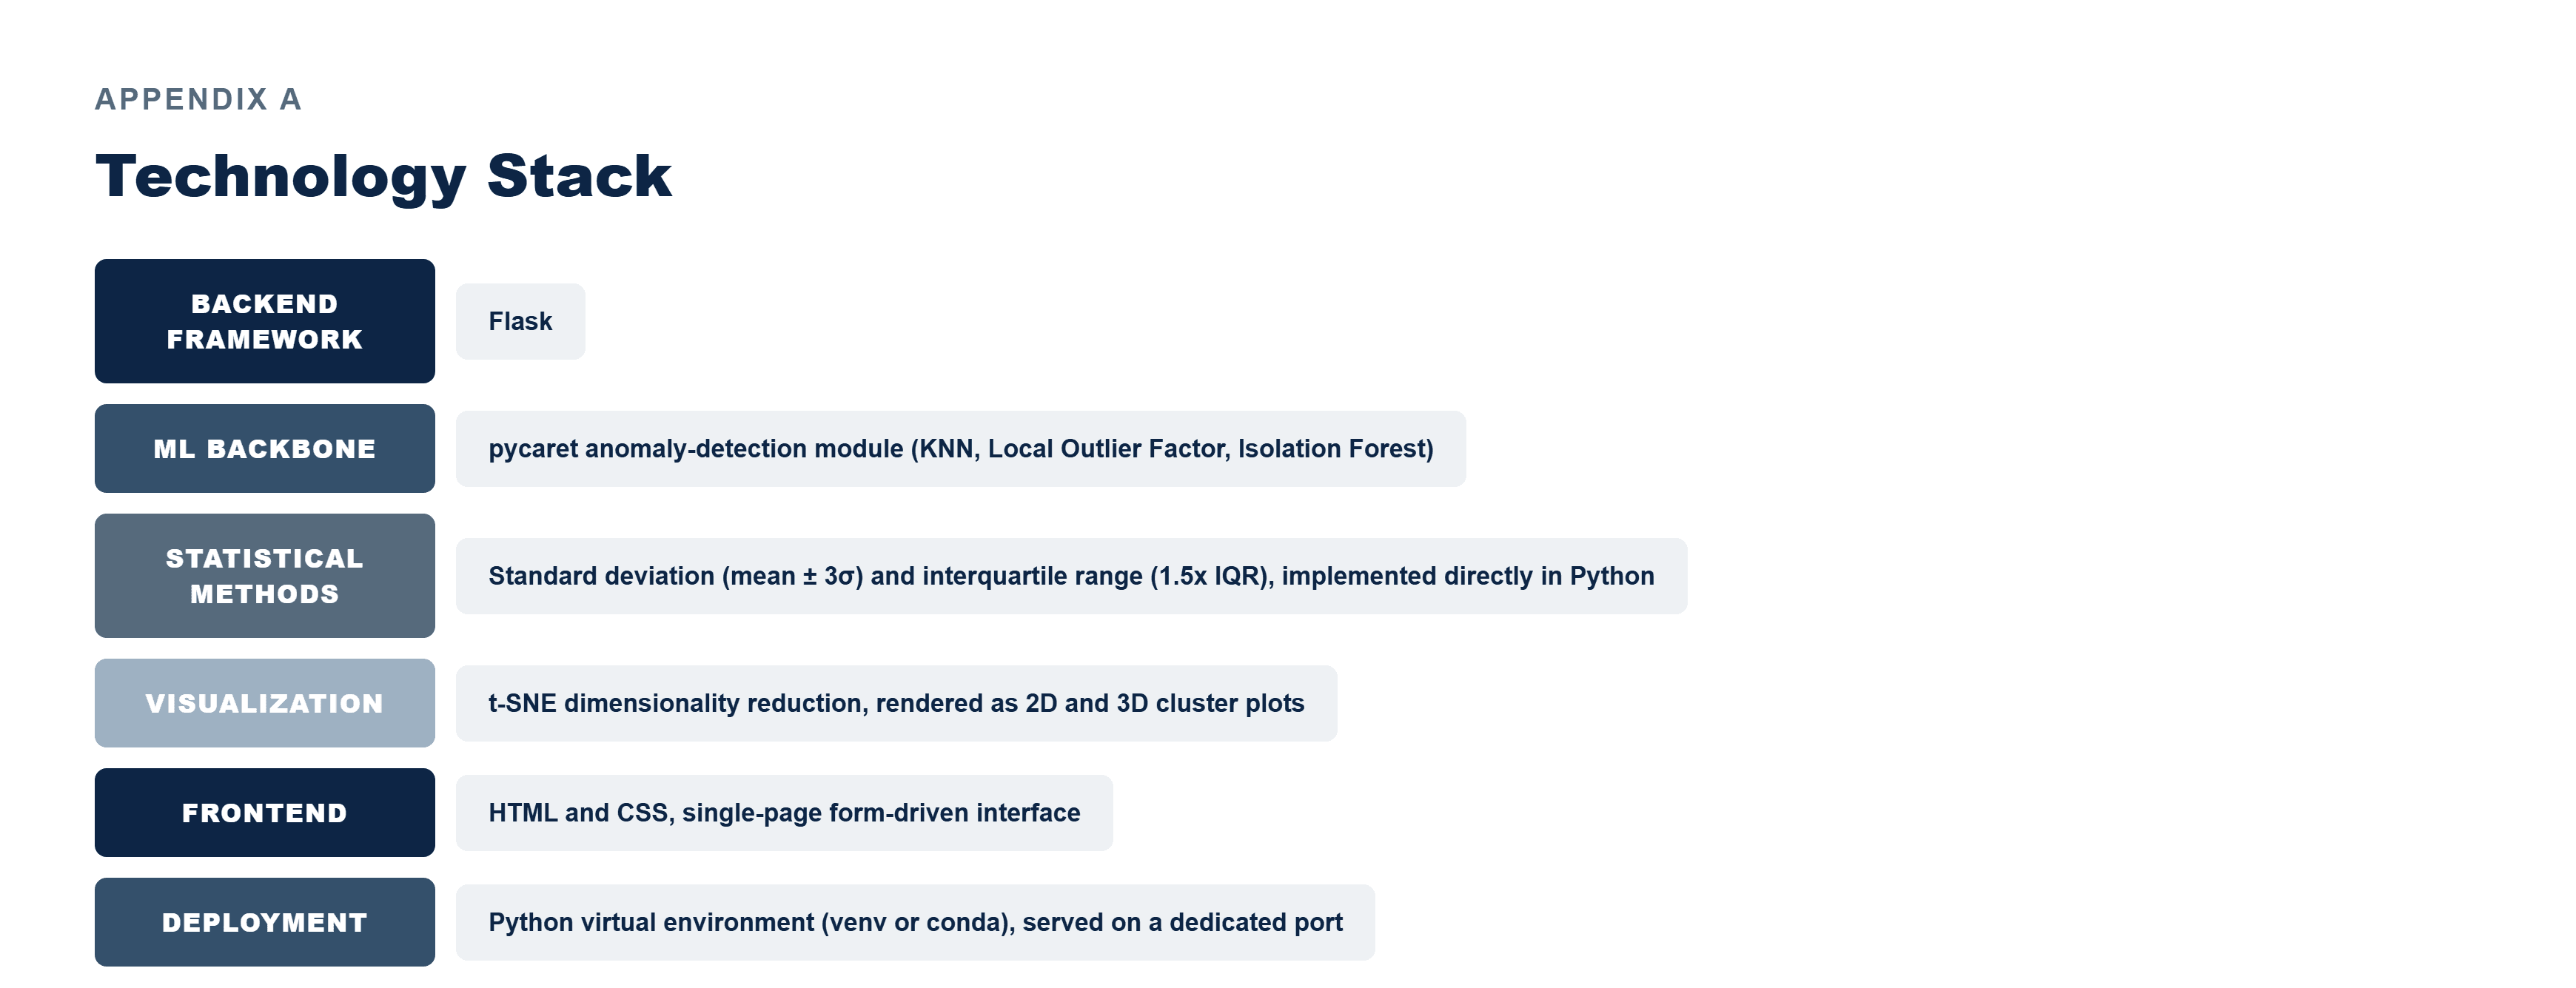
APPENDIX A - TECHNOLOGY STACK
The technology stack underpinning the system, grouped by the layer it serves.

Result and Analysis
ENGAGEMENT SNAPSHOT
How Pfactorial Technologies built Outliverse, a single-page application that lets a user detect anomalies in numerical datasets using statistical thresholds or unsupervised machine learning, without writing code.
CASE STUDIES
You might also like...

Analytics & BI DashboardsAutomotive & Vehicle
Aug 21, 20267 min readRead

RAG & Semantic Search
A Layered Analytics Platform for CXO-Level Decision-Making
Aug 21, 20268 min readRead

Analytics & BI DashboardsMulti-Agent & Agentic Systems
An AI That Interviews Employees to Reveal the Real Business Process Behind the Documented One
Aug 21, 20267 min readRead

Finance & Payments
An AI-Powered Market Intelligence Terminal for Faster Investment Research
Aug 21, 20266 min readRead

Analytics & BI Dashboards
Integrating i2b2, RStudio and LifeOmic Into One Clinical Research Analytics Workflow
Aug 21, 20267 min readRead

Data AnalyticsMySQLGoogle Analytics+1
Marketing Dashboard
Jun 21, 20242 min readRead