Back
Computer Vision
Recovering Structured Data From Static Chart Images
A computer-vision-and-language-model pipeline that converts static line-chart images into clean, analysis-ready JSON datasets - with no manual re-keying.
August 21, 2026
Share
ENGAGEMENT SNAPSHOT

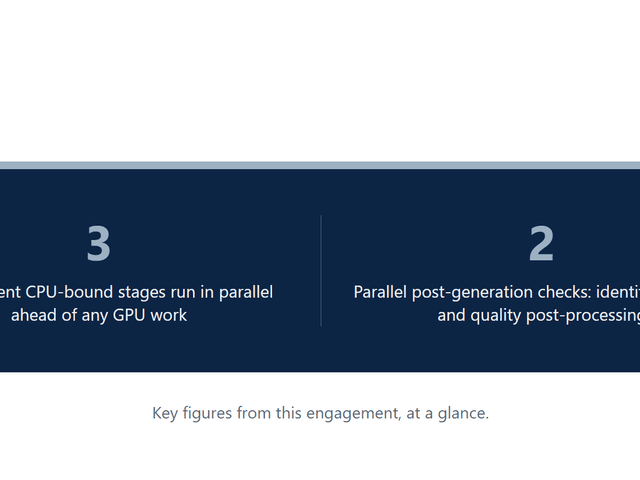
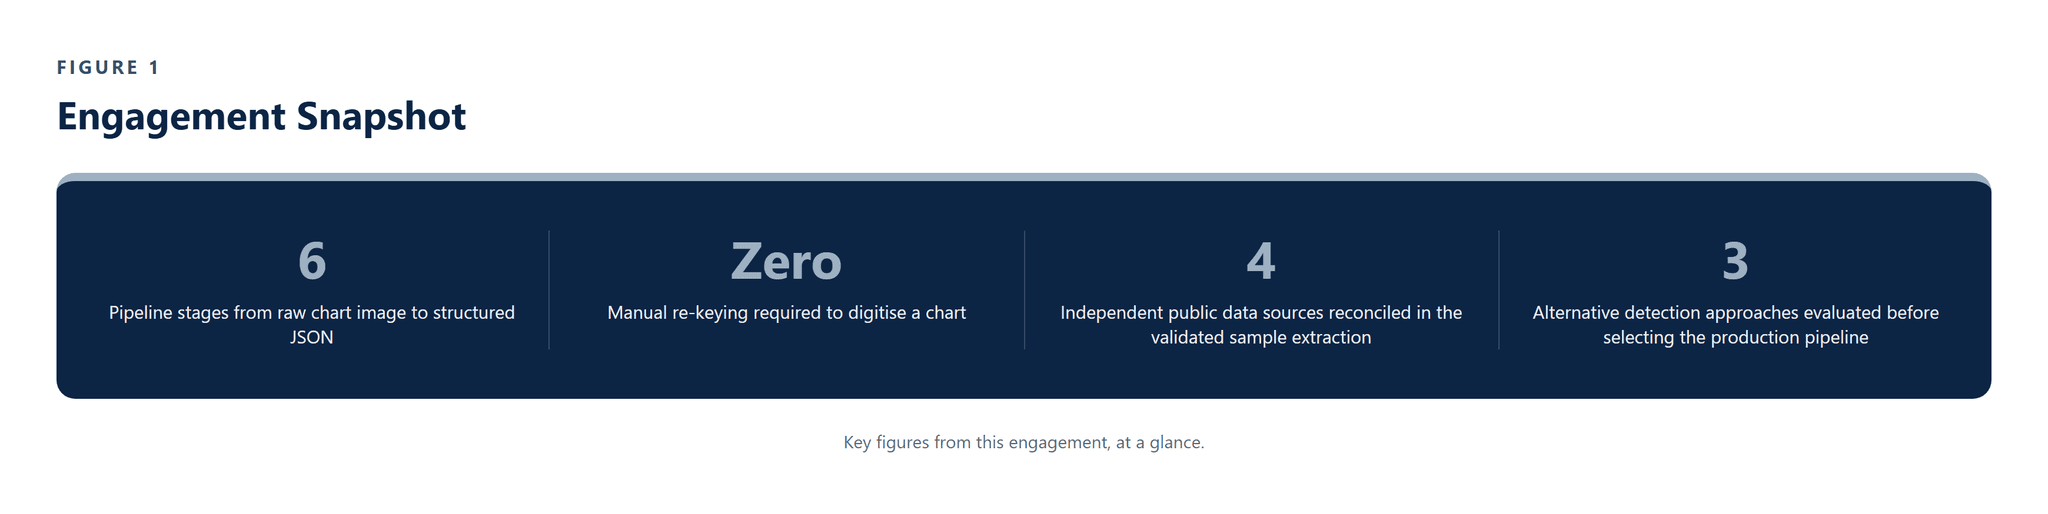
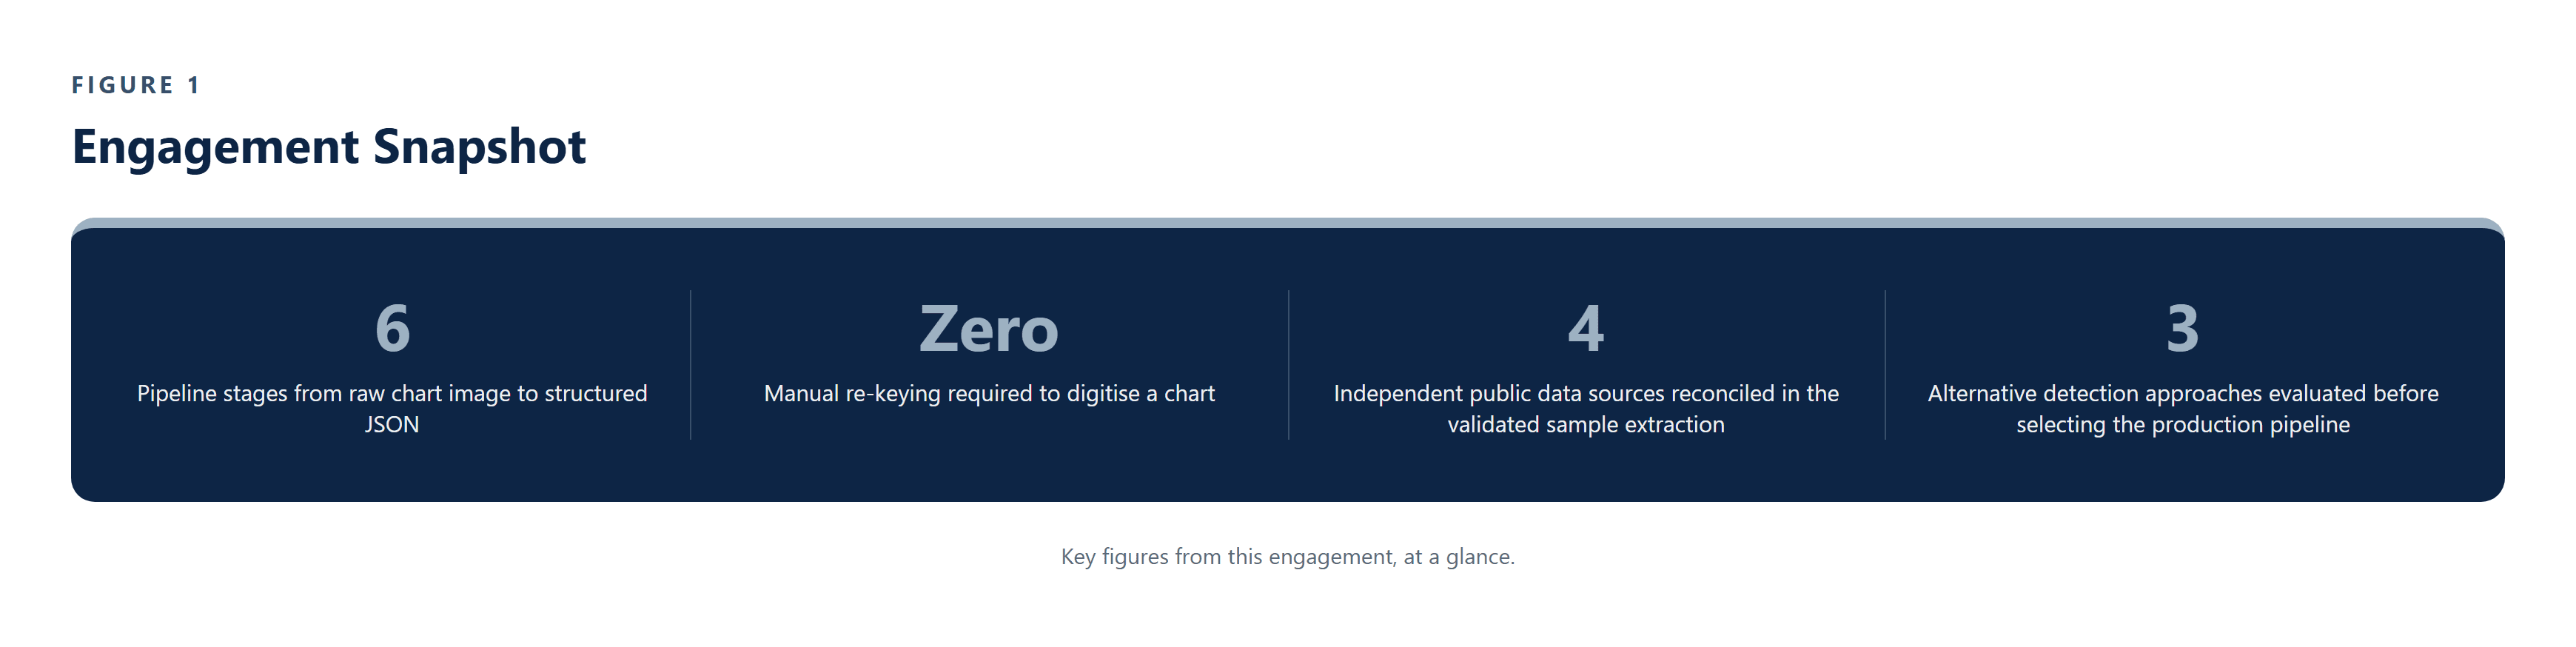
Figure 1 - Key figures from this engagement, at a glance.
EXECUTIVE SUMMARY
Our client's analysts and researchers relied on charts embedded in exported reports, archived dashboards, and third-party publications as effectively their only access to certain numbers. The data behind those charts existed once, but only as pixels - not as anything a spreadsheet, BI tool, or downstream model could consume.
Pfactorial Technologies built the Chart Data Extraction Engine to close that gap: a multi-stage pipeline that reads a static line-chart image the way a human analyst would, and returns a structured JSON dataset that mirrors the chart's original series, axes, and labels.
The system pairs a transformer-based line-detection model with a language model used specifically for what language models are good at - reading axis ticks, legend text, and colour-to-series associations - rather than asking one model to do both jobs. Every extraction is validated by re-plotting the recovered data and comparing it against the source chart before the output is accepted.
Why this engagement is representative This engagement demonstrates Pfactorial's approach to a common but under-solved problem: recovering real, structured data trapped inside an image, rather than settling for OCR text or a rough visual approximation - pairing a purpose-built vision model with a language model only where language understanding is actually the right tool.
THE CHALLENGE
Charts and graphs are one of the most common ways data is shared - in reports, research papers, and dashboards - yet the numbers behind them are rarely available in a form anyone can actually use. Four problems stood between a chart image and a usable dataset.
1. The numbers only exist as pixels
A chart image communicates a shape, not a value. Recovering the real-world numbers behind each line means solving detection, calibration, and semantic interpretation together - not just running OCR over the image.
2. Real-world charts overlap and cross
Multi-series charts routinely have lines that cross, share similar colours, or run close together. Simple approaches like colour-thresholding work on clean, single-series test images but lose track of series identity the moment two lines intersect.
3. Axes and legends follow no fixed format
Date ticks, percentage labels, and custom colour legends vary from chart to chart and tool to tool. There is no universal template to parse against - each chart's labelling has to be read and interpreted on its own terms.
4. Source image quality is inconsistent
Charts arrive as screenshots, scanned documents, and exported reports, each with different resolution, noise, and contrast characteristics. A pipeline tuned to one capture method breaks on the others.
The real brief Not "read this one chart" but "digitise any static line chart, regardless of source or styling, without a human re-keying a single number."
THE SOLUTION
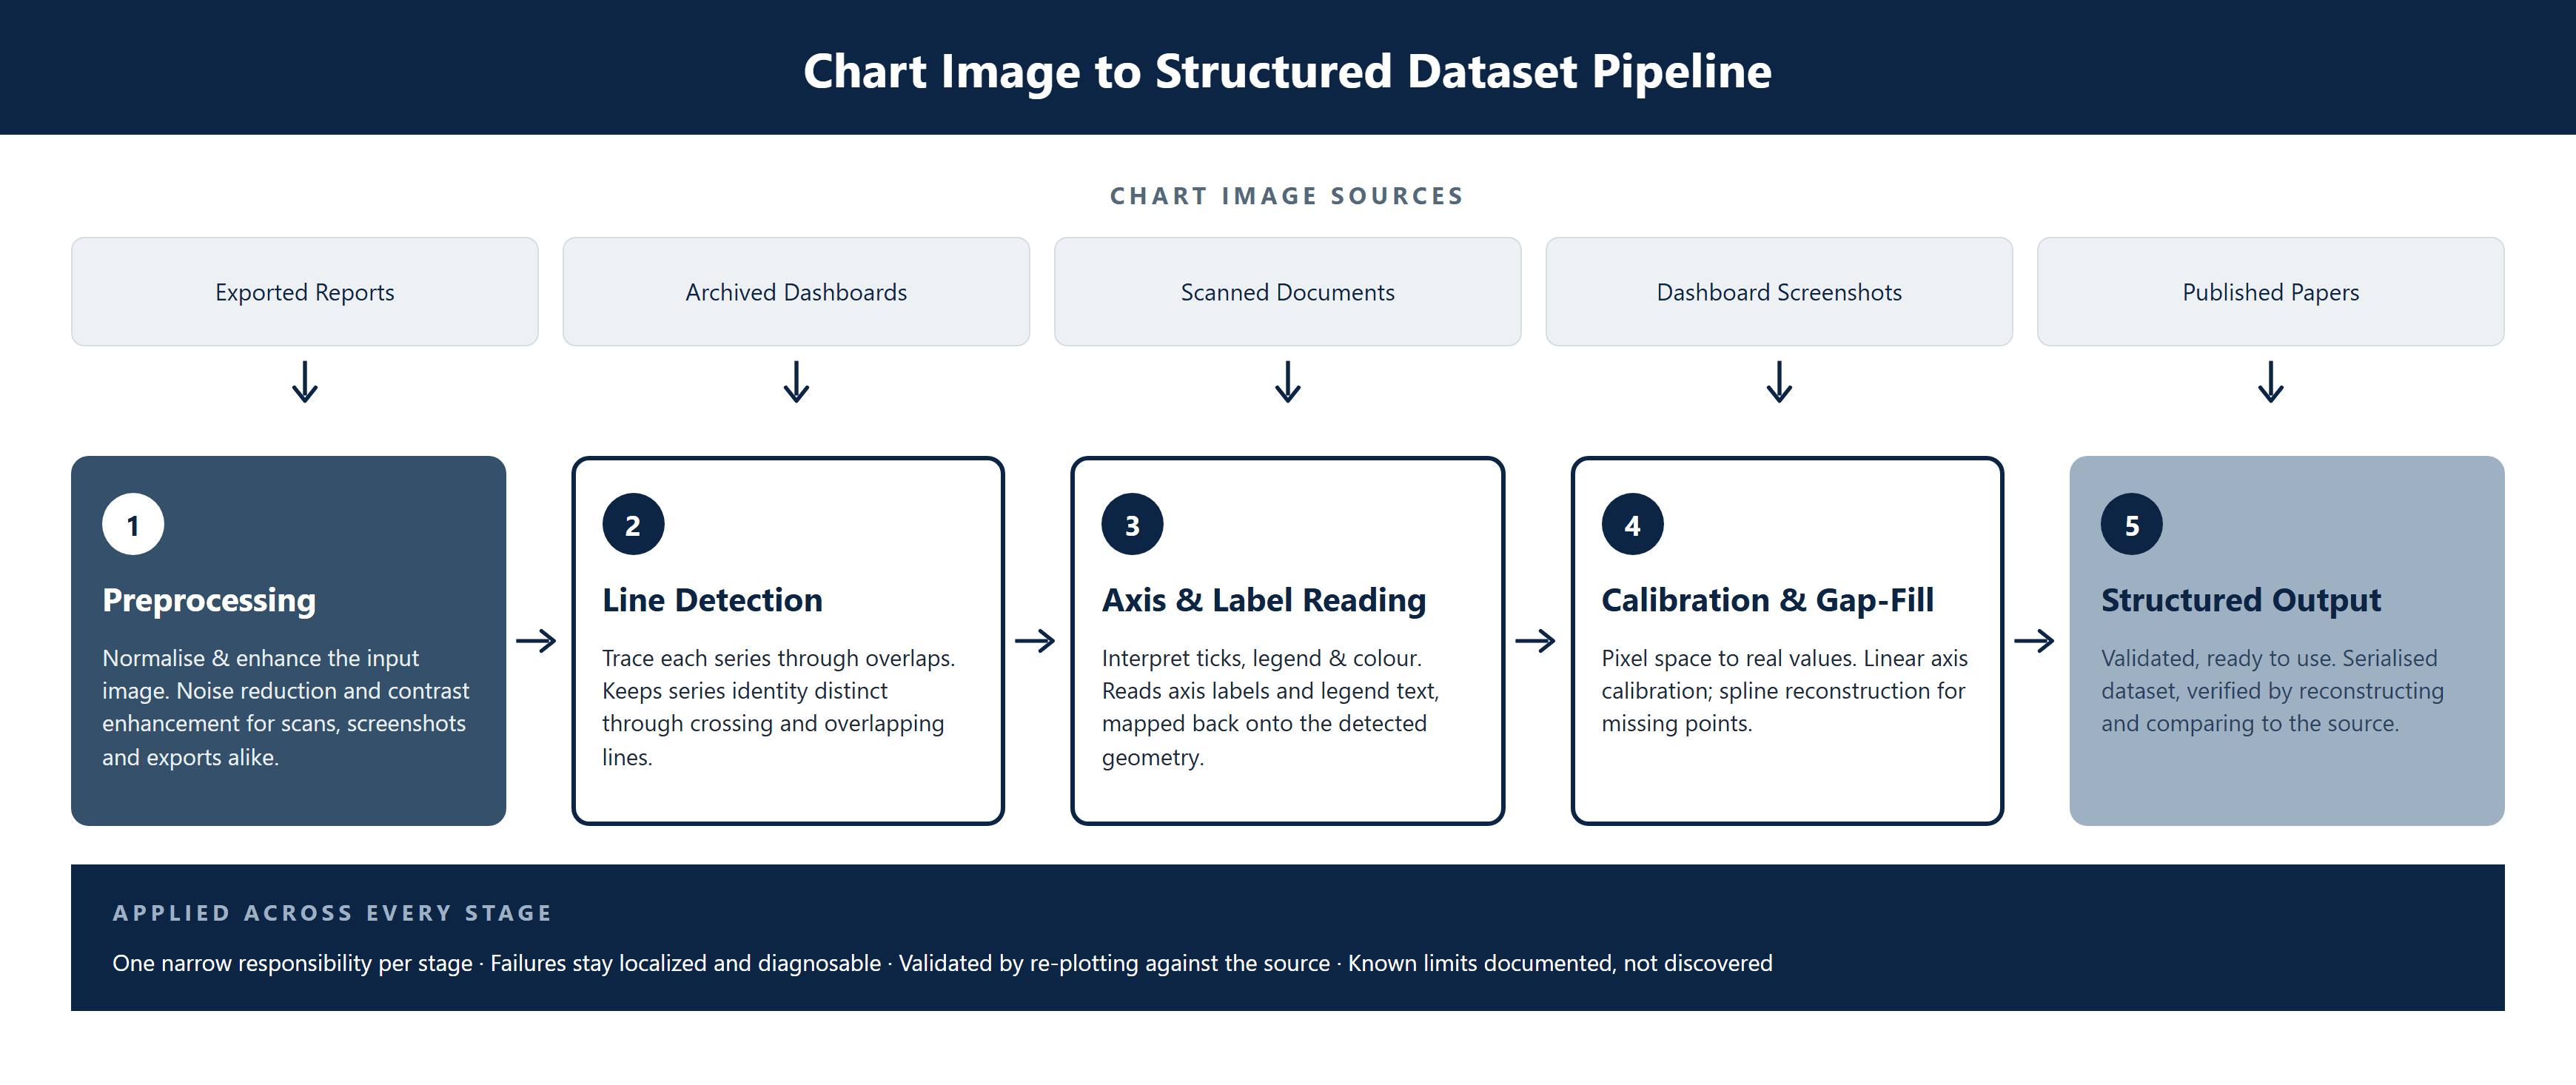
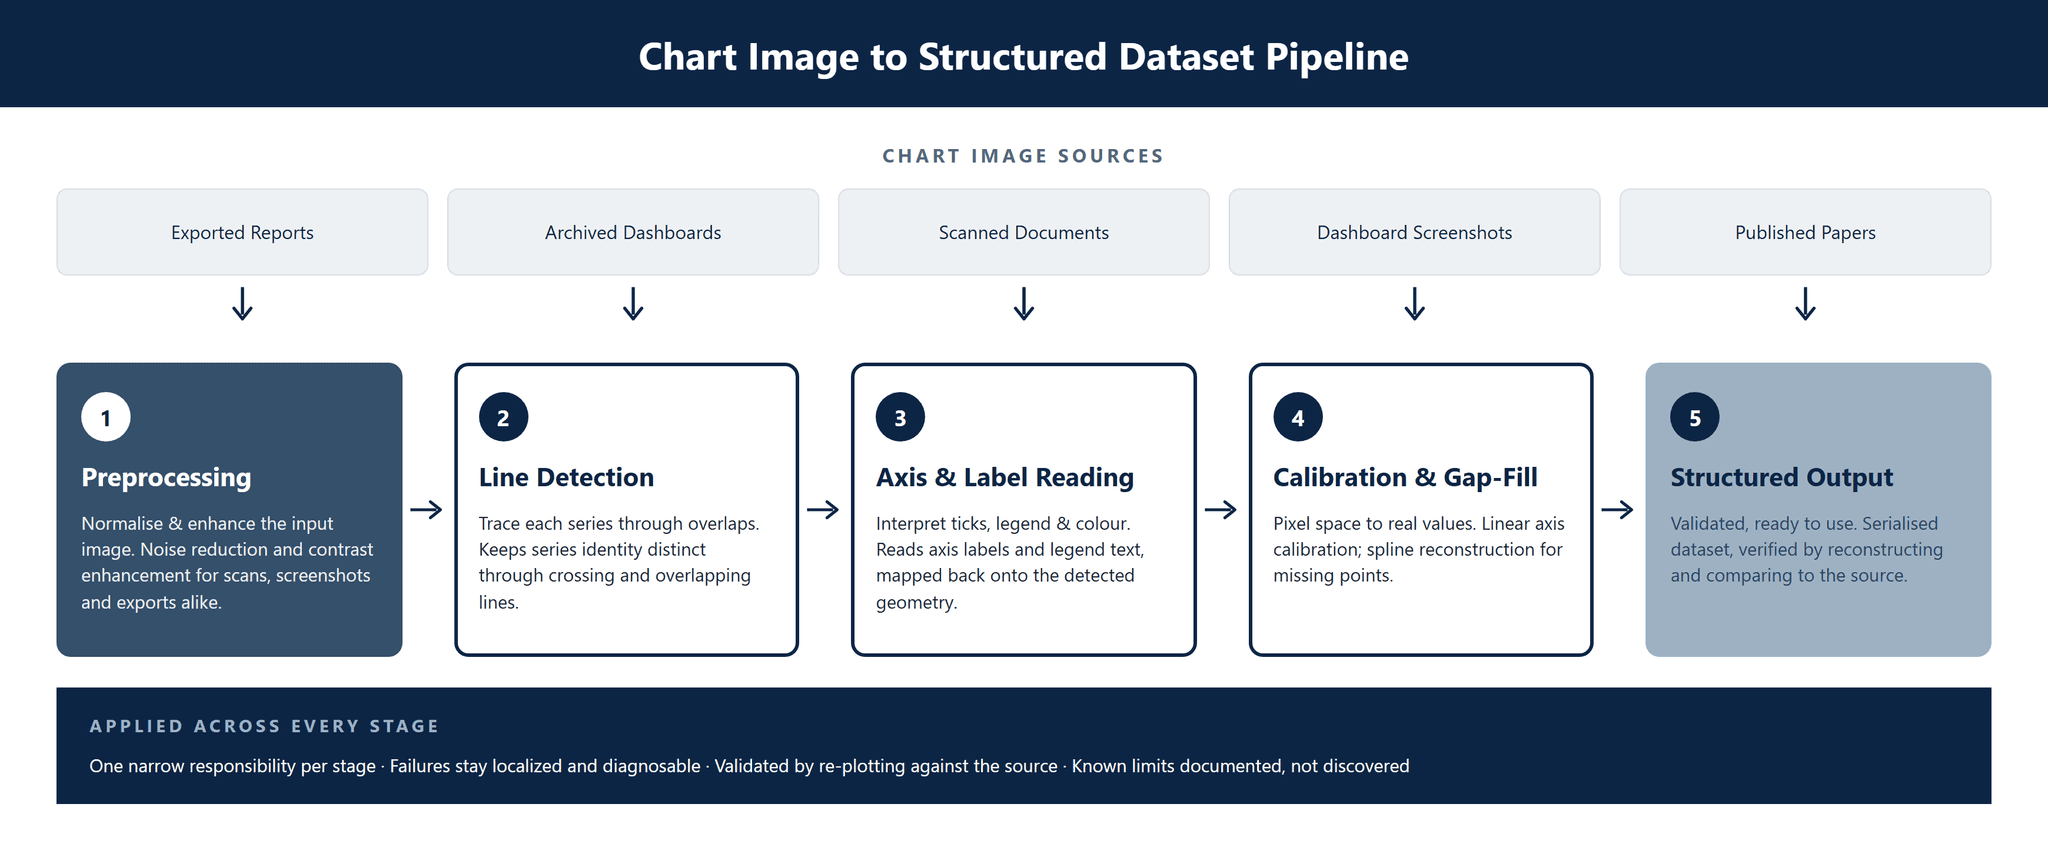
Pfactorial built the engine as a multi-stage pipeline rather than a single model call, with each stage owning one narrow, well-defined responsibility. That separation keeps failures localized and makes every step independently testable.

Figure 1 - End-to-end pipeline: preprocessing, transformer-based line detection, axis and legend interpretation, calibration, gap-filling, and structured JSON output.
Architectural principles
- Narrow, staged responsibility - image preparation, line detection, coordinate extraction, axis calibration, data cleaning, and structured storage are each a separate stage, so a failure in one is localized and easy to diagnose.
- Shape and meaning, solved separately - line geometry is a computer-vision problem; reading what a line means from its axis labels and legend is a language problem. The pipeline uses a different model for each, rather than asking one model to do both.
- Pretrained where pretrained is enough - the line-detection model is used with its existing, pretrained weights rather than trained from scratch - engineering effort goes into the calibration, interpolation, and mapping logic built around it.
- Validate by reconstruction - every output is re-plotted and visually compared against the original chart as a standard step in the pipeline, not a one-off manual QA pass.
CAPABILITIES DELIVERED
The engine's capabilities span the full path from a raw chart image to a dataset ready for downstream use.
CAPABILITY | WHAT IT DOES |
|---|---|
Image Preprocessing | Normalises and enhances screenshots, scans, and exported charts before detection, regardless of how the original was captured. |
Transformer-Based Line Detection | Identifies each data series as a sequence of points and tracks its identity through overlaps and crossings that simpler detectors lose. |
Axis & Legend Interpretation | Reads tick labels, legend entries, and colour-to-series associations, and maps them back onto the detected line geometry. |
Pixel-to-Value Calibration | Converts raw pixel coordinates into real axis units via interpolation between labelled tick positions. |
Gap Reconstruction | Fills missing or unevenly spaced points using spline interpolation, preserving the original curve shape through the gap. |
Built-In Validation | Re-plots every extraction and compares it against the source chart before the structured output is accepted. |
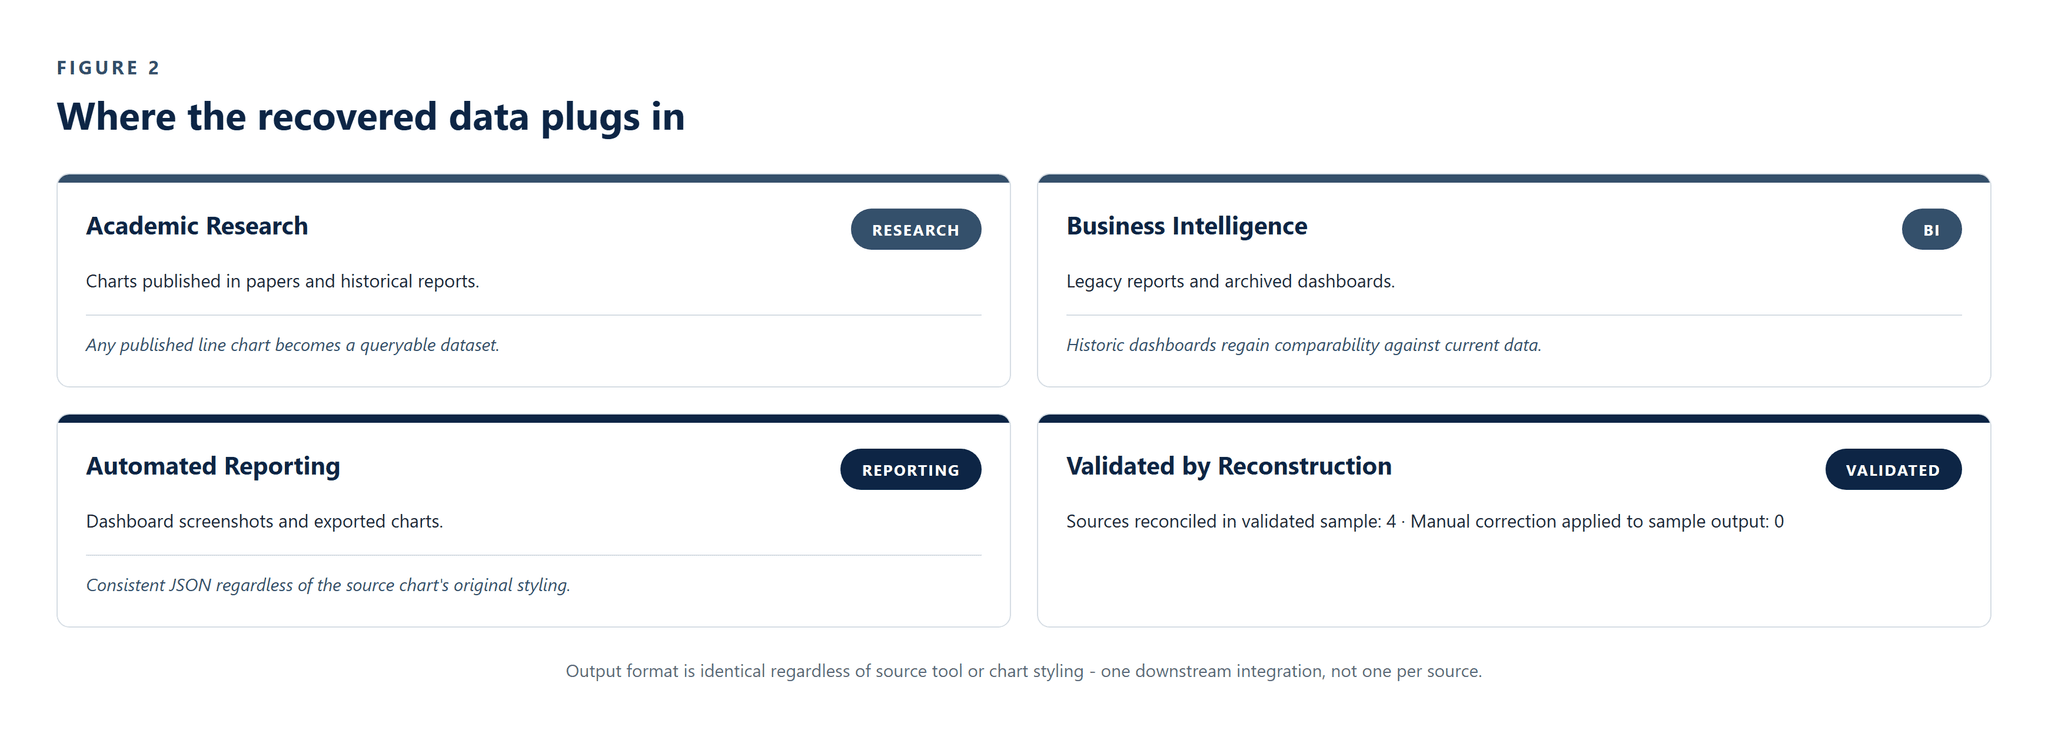
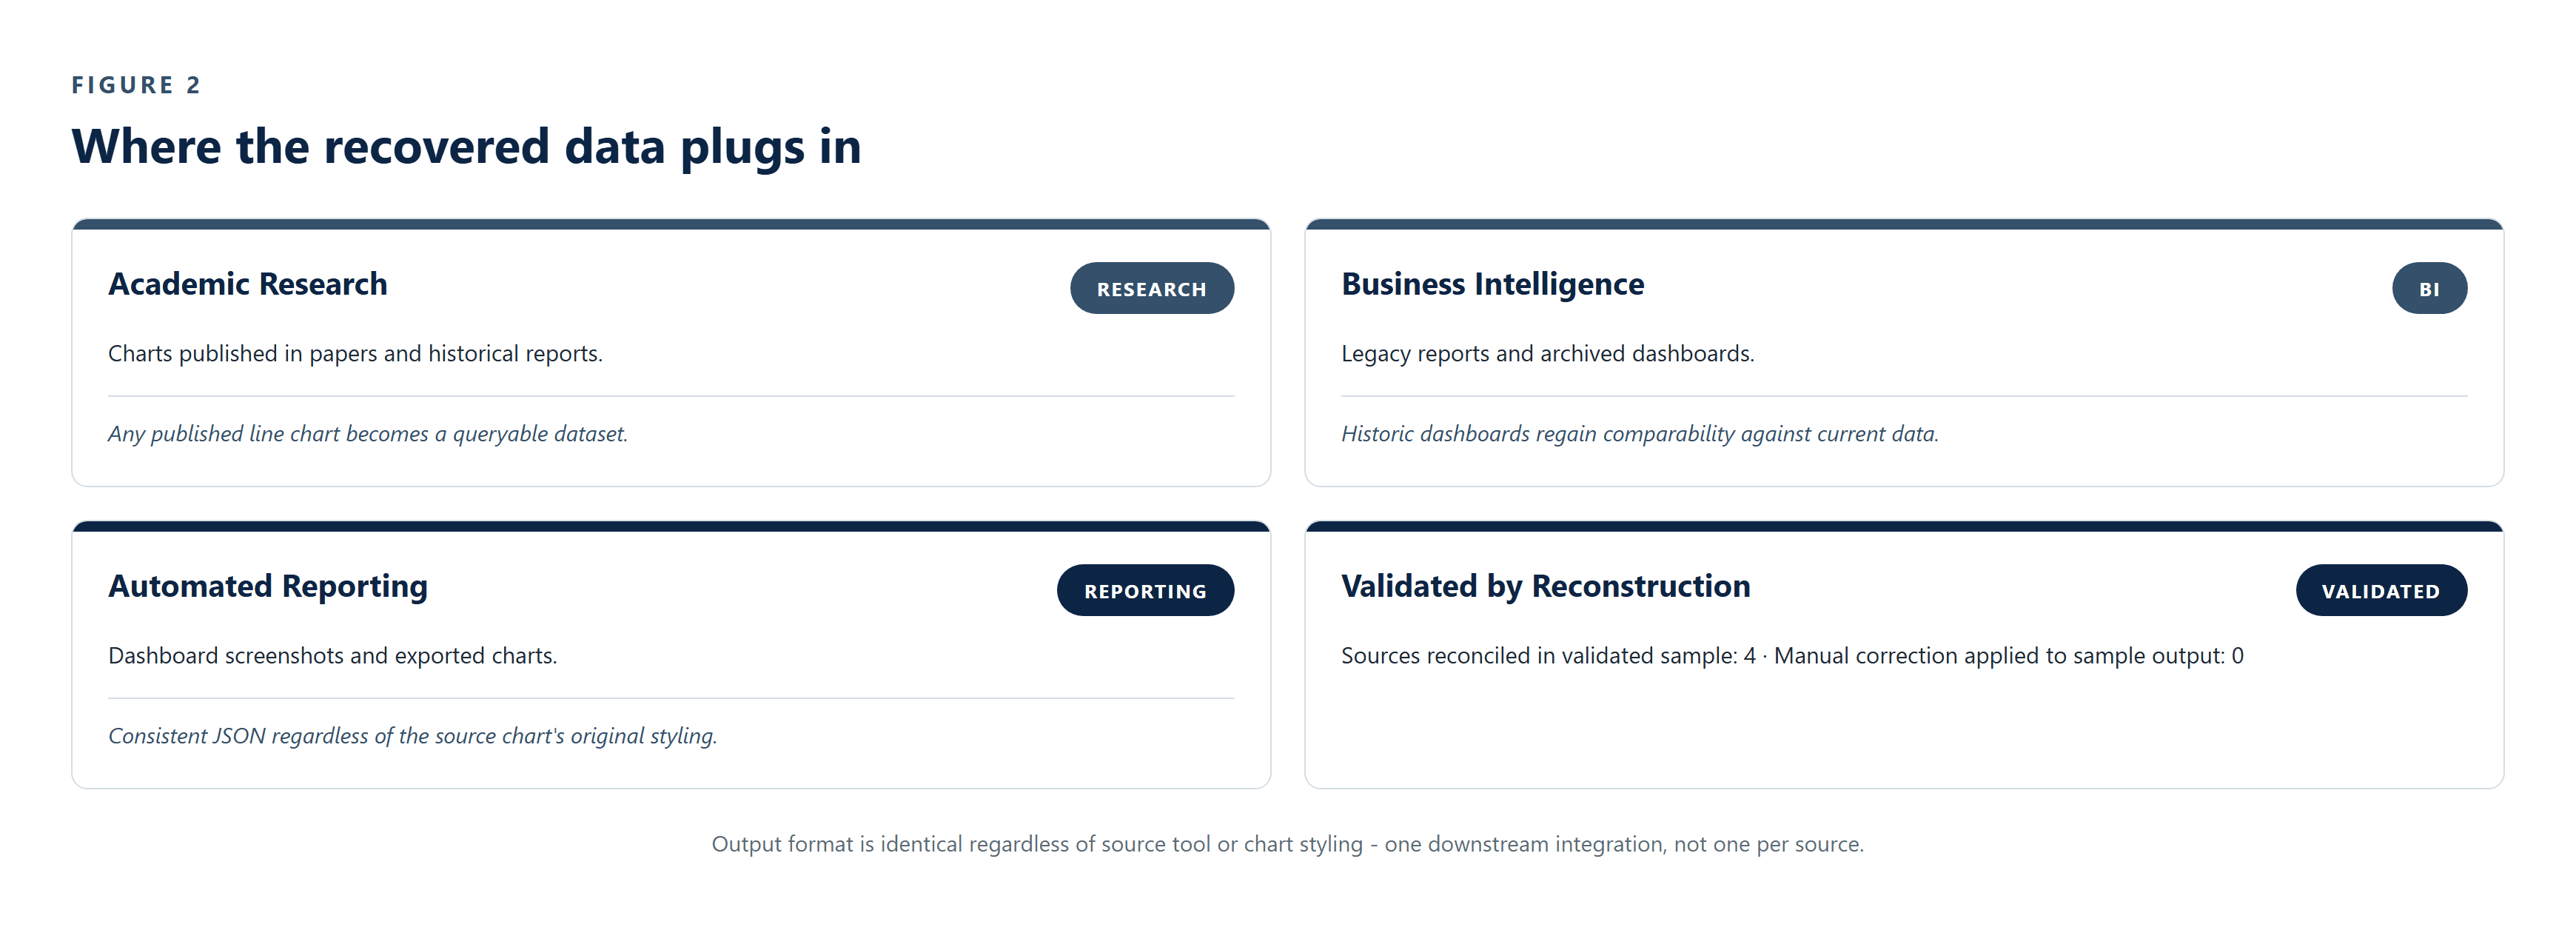
Figure 2 - Where the recovered data plugs in, and how every extraction is checked before it is accepted.
Design note The current pipeline is purpose-built and validated for line charts; bar, pie, and other chart types are handled as a separate extraction path. Non-linear or logarithmic axes are outside current scope and require the axis type to be specified explicitly for calibration to apply correctly.
ENGINEERING FOR SCALE AND RELIABILITY
Several engineering decisions distinguish a pipeline that works on a clean demo chart from one that holds up on real, messy, real-world chart imagery.
Pretrained detection, purpose-built surroundings
The line-detection model is applied with its existing line-segmentation weights rather than retrained from scratch, while preprocessing, calibration, interpolation, and label mapping are purpose-built for chart digitisation specifically.
Built for line overlap
The detection model's attention-based architecture models long-range spatial relationships along a curve, keeping two overlapping lines distinct even where they visually cross - the failure mode that simpler colour- or position-based detectors exhibit.
Linear axis calibration, by design
Axis calibration currently applies linear interpolation between labelled ticks, which is accurate for the linear and percentage-based axes the system targets. Non-linear or logarithmic scales require the axis type to be specified so calibration logic can be applied accordingly.
Robust to inconsistent input quality
The preprocessing stage applies noise reduction and contrast enhancement ahead of detection, standardising input quality whether the source is a screenshot, a scan, or an exported report.
Explicitly scoped to line charts
The pipeline is validated for line charts, where the detection model's line-segmentation approach directly applies. Other chart types fall outside this model's detection scope and are handled as a separate extraction path rather than forced through the same one.
Alternatives evaluated and rejected on evidence
Colour-thresholding, OCR plus rule-based extraction, and non-transformer CNN detectors were each tested against real multi-series charts and found to break down on overlapping lines or lose series identity at crossing points before the current approach was selected.
DELIVERY APPROACH
The engagement moved from evaluating extraction strategies to a validated, self-checking pipeline in six phases.
1. Evaluate extraction approaches - tested colour-thresholding, OCR plus rule-based extraction, and CNN-based object detectors against real multi-series charts before selecting a transformer-based approach.
2. Select and adapt the detection model - adopted a pretrained transformer-based line-detection model rather than training from scratch, and built the preprocessing stage around its input requirements.
3. Build axis and legend interpretation - added a language-model stage to read tick labels, legend entries, and colour-to-series mapping, kept separate from line-shape detection.
4. Add calibration and gap-filling - implemented linear interpolation for pixel-to-value axis calibration and spline interpolation for reconstructing missing or unevenly spaced points.
5. Build in validation - added a re-plotting step so every extraction is visually checked against its source chart as a standard part of the pipeline, not a one-off test.
6. Document constraints and scope - recorded known limits - non-linear axes, non-line chart types - explicitly, so the system's boundaries are known rather than discovered in production.
RESULTS AND IMPACT

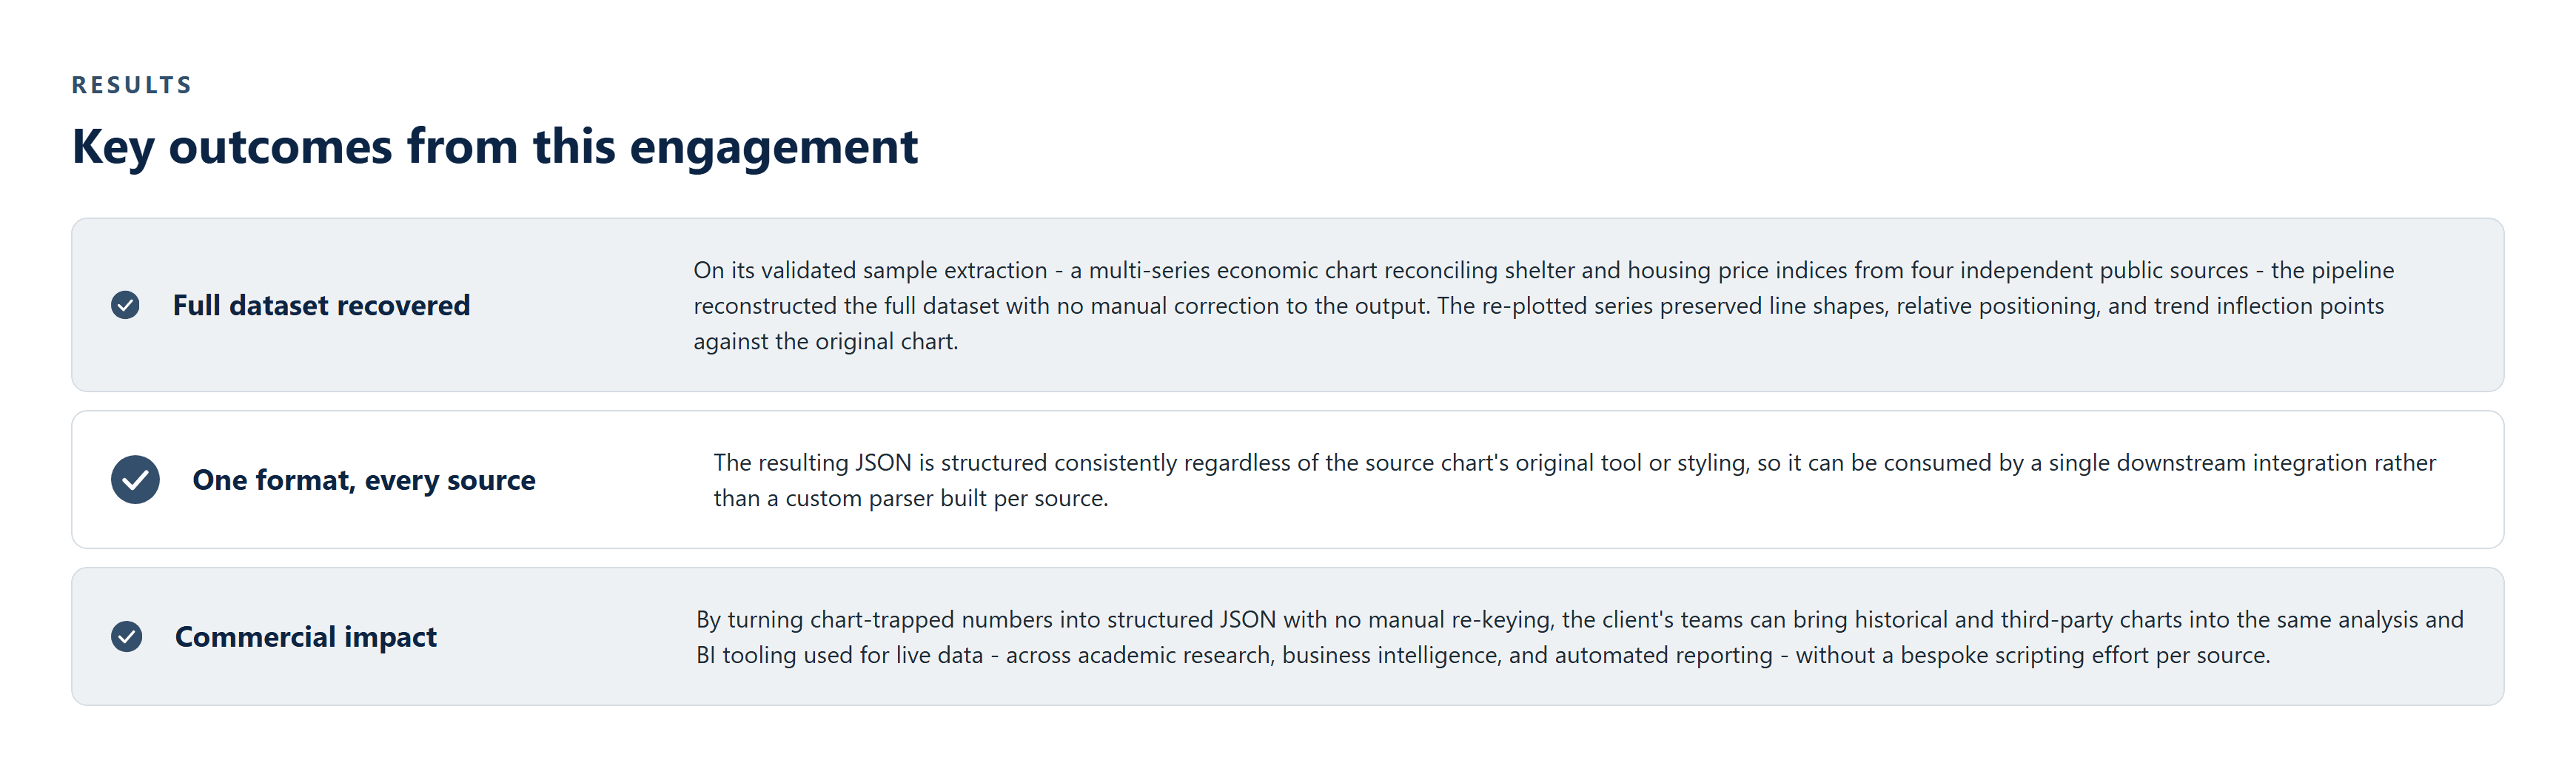
Figure - Key outcomes from this engagement.
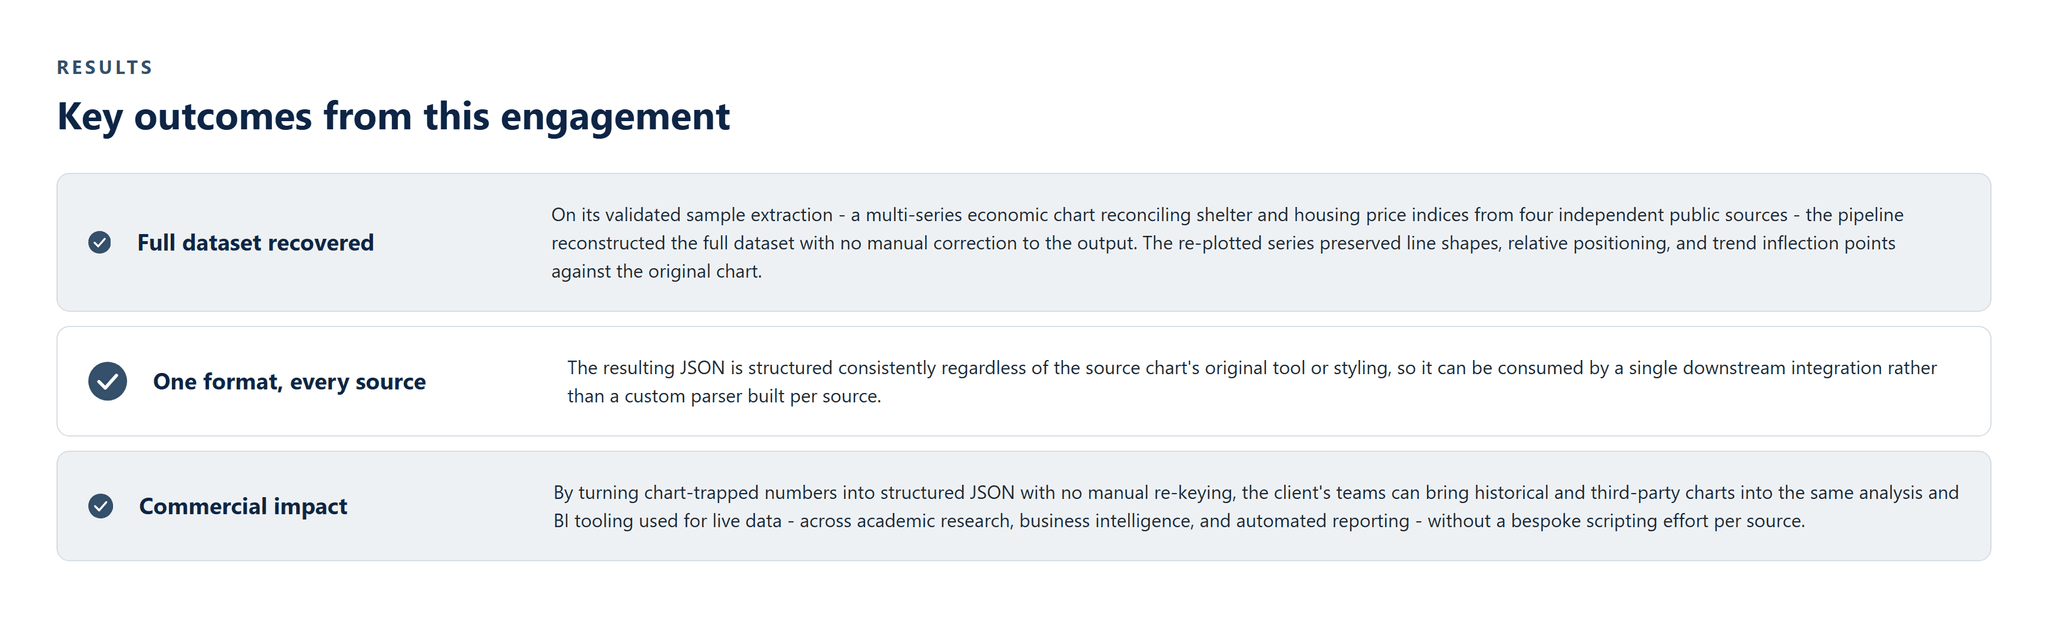
On its validated sample extraction - a multi-series economic chart reconciling shelter and housing price indices from four independent public sources - the pipeline reconstructed the full dataset with no manual correction to the output. The re-plotted series preserved line shapes, relative positioning, and trend inflection points against the original chart.
The resulting JSON is structured consistently regardless of the source chart's original tool or styling, so it can be consumed by a single downstream integration rather than a custom parser built per source.
What it enabled commercially
By turning chart-trapped numbers into structured JSON with no manual re-keying, the client's teams can bring historical and third-party charts into the same analysis and BI tooling used for live data - across academic research, business intelligence, and automated reporting - without a bespoke scripting effort per source.
WHY PFACTORIAL
This engagement draws on Pfactorial's data and pipeline infrastructure capability: purpose-built extraction systems that combine computer vision with language-model reasoning, each used for what it is actually best at, and validated the way production systems are rather than left as an unverified prototype.

Figure - Service lines this engagement draws on.
Engagement enquiries Pfactorial Technologies works with teams whose data is trapped in a format nobody planned for - a chart, a scanned document, a legacy export. If you are evaluating whether an extraction problem like this is worth solving properly, we are happy to give you an honest read on scope, cost, and risk before anyone commits to anything. · pfactorial.ai
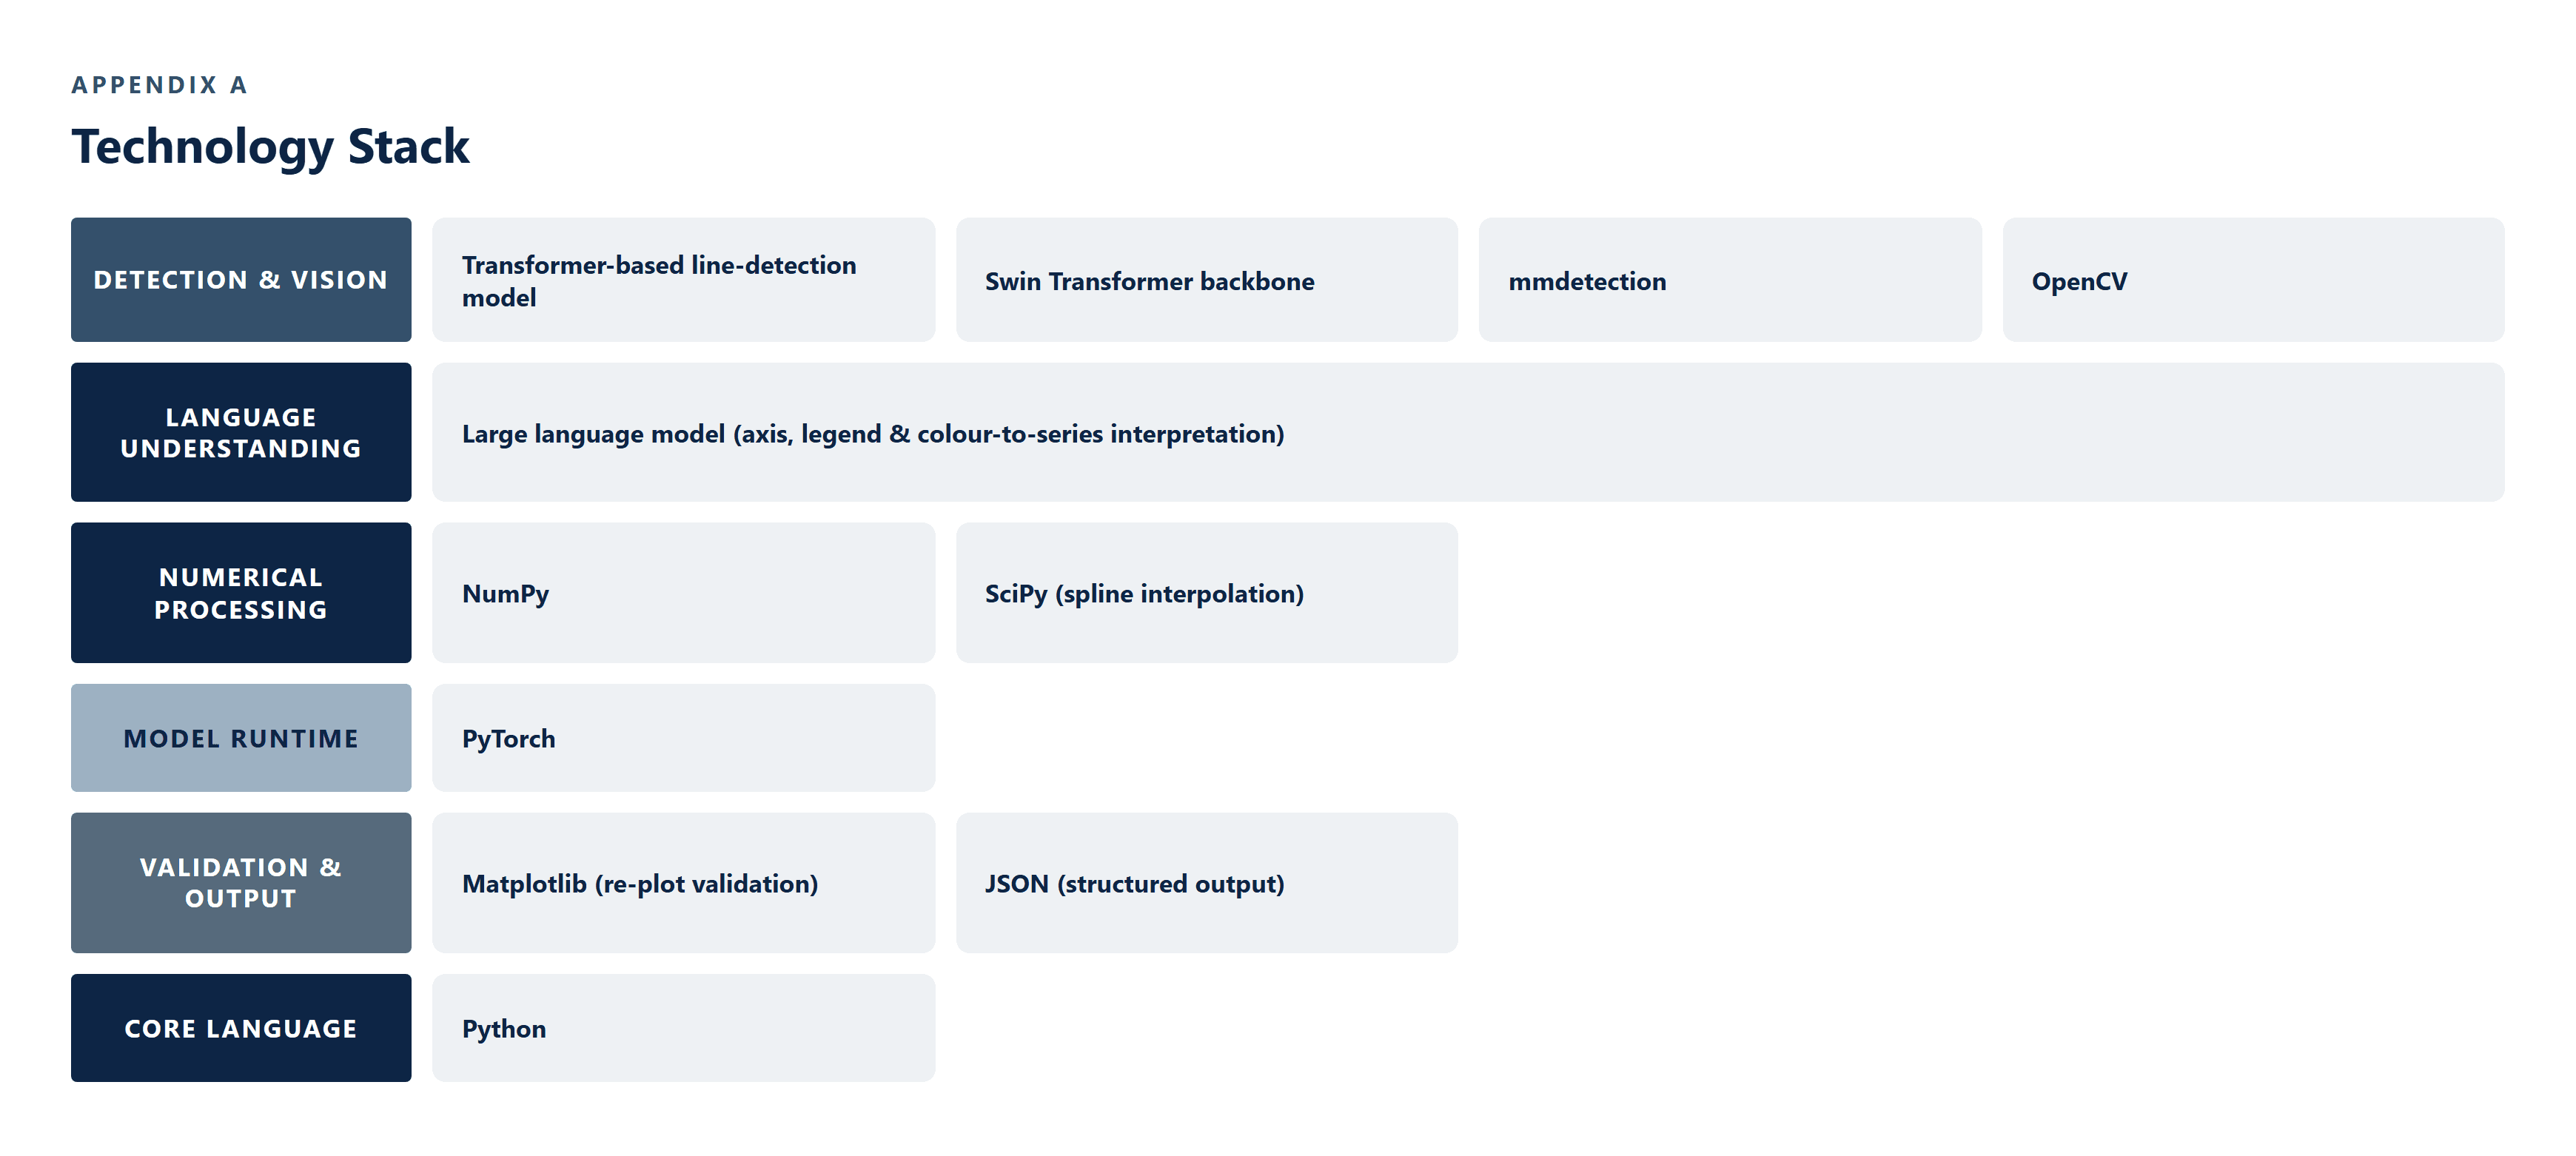
APPENDIX A - TECHNOLOGY STACK
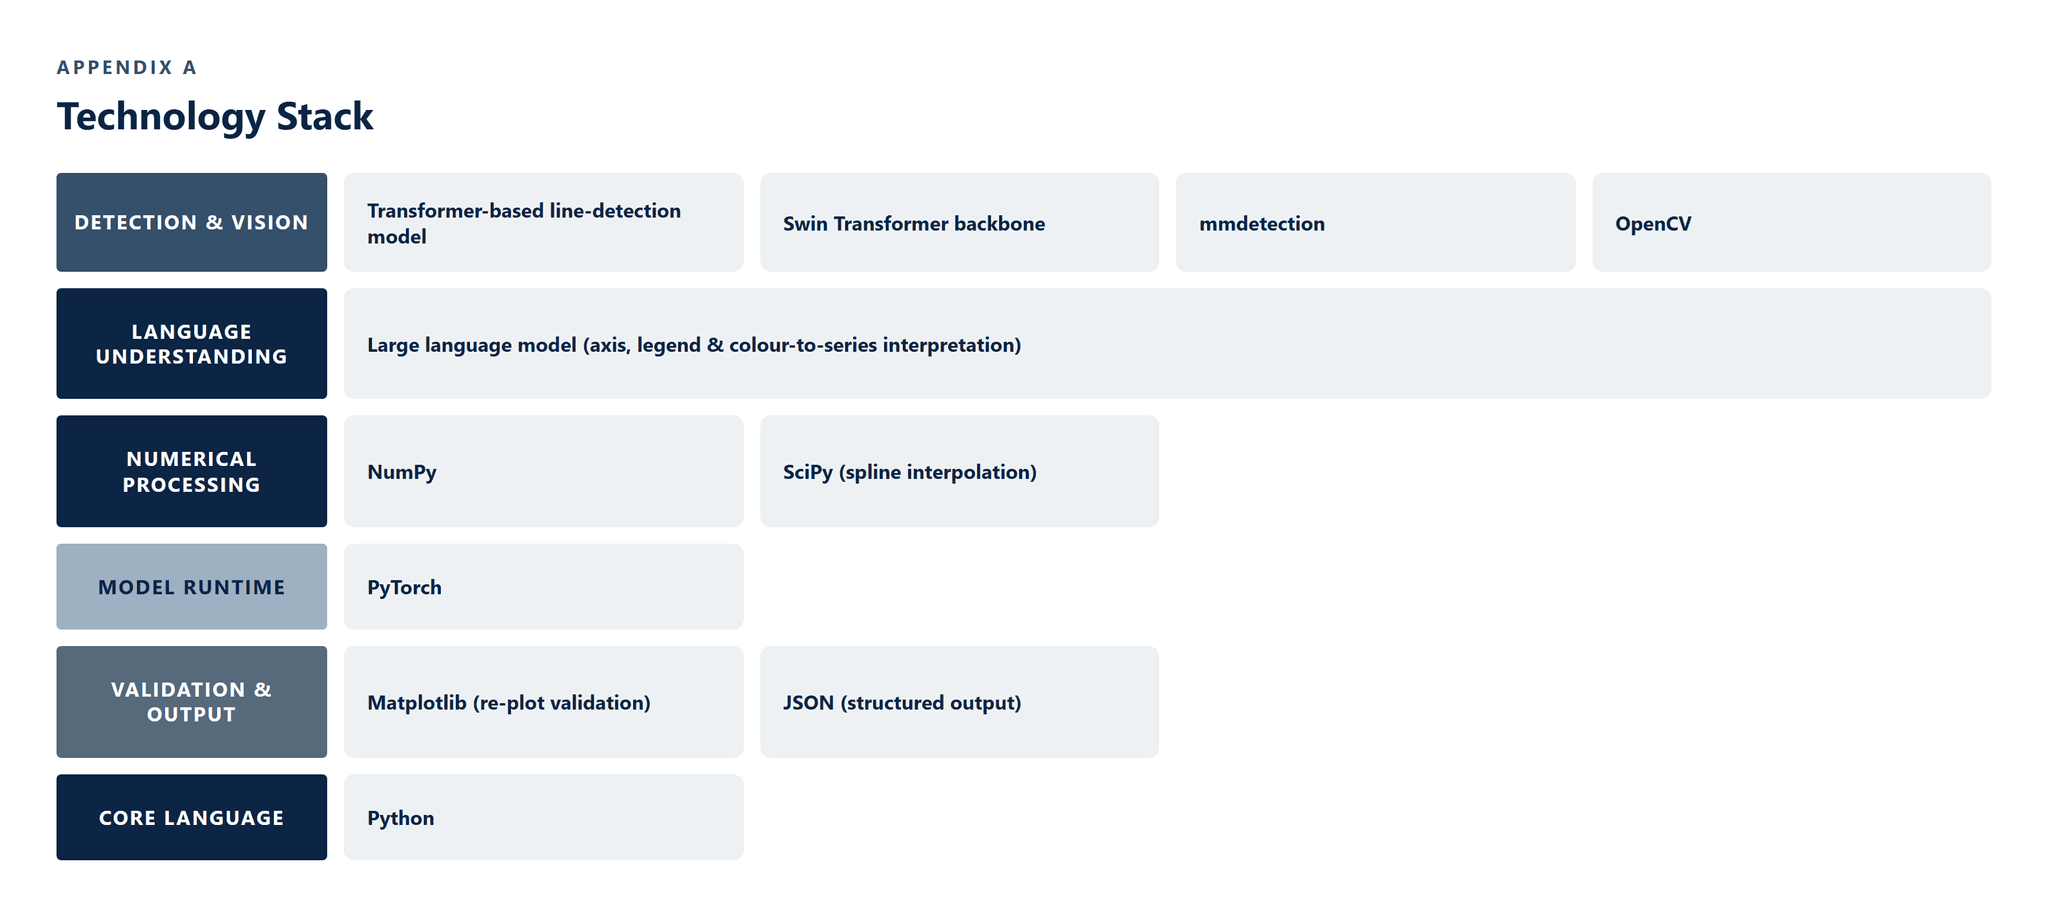
The technology stack underpinning the system, grouped by the layer it serves.

Result and Analysis
ENGAGEMENT SNAPSHOT
A computer-vision-and-language-model pipeline that converts static line-chart images into clean, analysis-ready JSON datasets - with no manual re-keying.
CASE STUDIES
You might also like...

OCR & Document ExtractionAutomotive & Vehicle
Aug 21, 20267 min readRead

Computer VisionML Infra, Classifiers & RL
A Deep Learning Classifier That Separates True-Negative Mammograms from Genuine BIRADS 0 Cases
Aug 21, 20266 min readRead

Content & Media Generation
A Failover-Chained Text-to-Image Service Built on Three Stable Diffusion Models
Aug 21, 20267 min readRead

Analytics & BI DashboardsAutomotive & Vehicle
A Five-Capability Computer Vision Platform for Vehicle Identity, Traffic, and Parking Intelligence
Aug 21, 20267 min readRead

OCR & Document Extraction
A Hugging Face Inference-Backed Handwriting Transcription Tool for Single-Line Document Digitization
Aug 21, 20266 min readRead

A Shared-Model Architecture for Consistent AI Character Generation at Scale
Aug 21, 20268 min readRead