Back
July 01, 2024
Analytics & BI Dashboards
Analytical reports using python in Power BI
pfactorial
Share

Almost everyone in the tech industry knows about Power BI,one of the most used Business intelligence and data visualisation software.Many Data analysts use Power BI on a daily basis.To perform data manipulations and creating reports in Power BI,one needs to be really proficient in in DAX (Data analysis expressions).Even though python is a general purpose programming language and DAX is a domain specific language for data analysis,many tasks that can be done in DAX can also be accomplished in python by using libraries like pandas .There is an option in Power BI to use python for data analysis.
In this blog let’s understand the basics of using python inside powerbi and making a simple dashboard
Initial steps
To use python in Power BI , you need to install python on the system.
After installing python, install the following libraries:
In Power BI go to File > options and settings > options > python scripting
Select the path to your python interpreter and click ok to enable python scripting in the Power BI.
Sample superstore dashboard
Let’s create a sales dashboard using python inside Power BI.Here sample superstore dataset is used for creating the dashboard.It contains the sales data of different items in different categories.
Data preparation
In the sample superstore dashboard ,let’s assume that the sales column contains data related to the Sales of each item and the Quantity column contains the number of items.

Sample superstore dashboard
To calculate the total sales, the two columns are multiplied.Let’s see how we can do this using python inside the power query editor in Power BI.
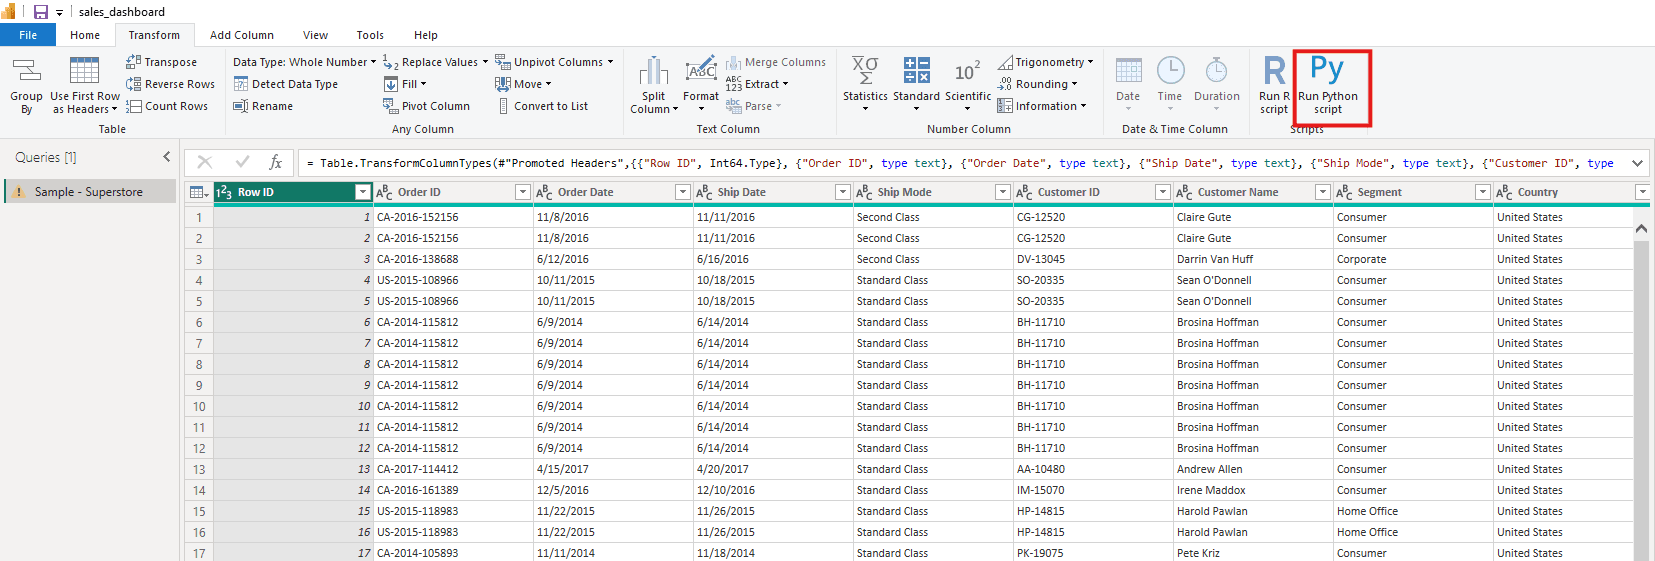
Open the dataset in the power query editor by clicking on the transform tab in power bi.Inside the editor go to the transform tab and click on ‘Run python script’.

A window will appear and here we can type our data manipulation code for creating the new column using pandas .Click ‘ok’ for creating the new column and save the changes in the power query editor.

Visualisation
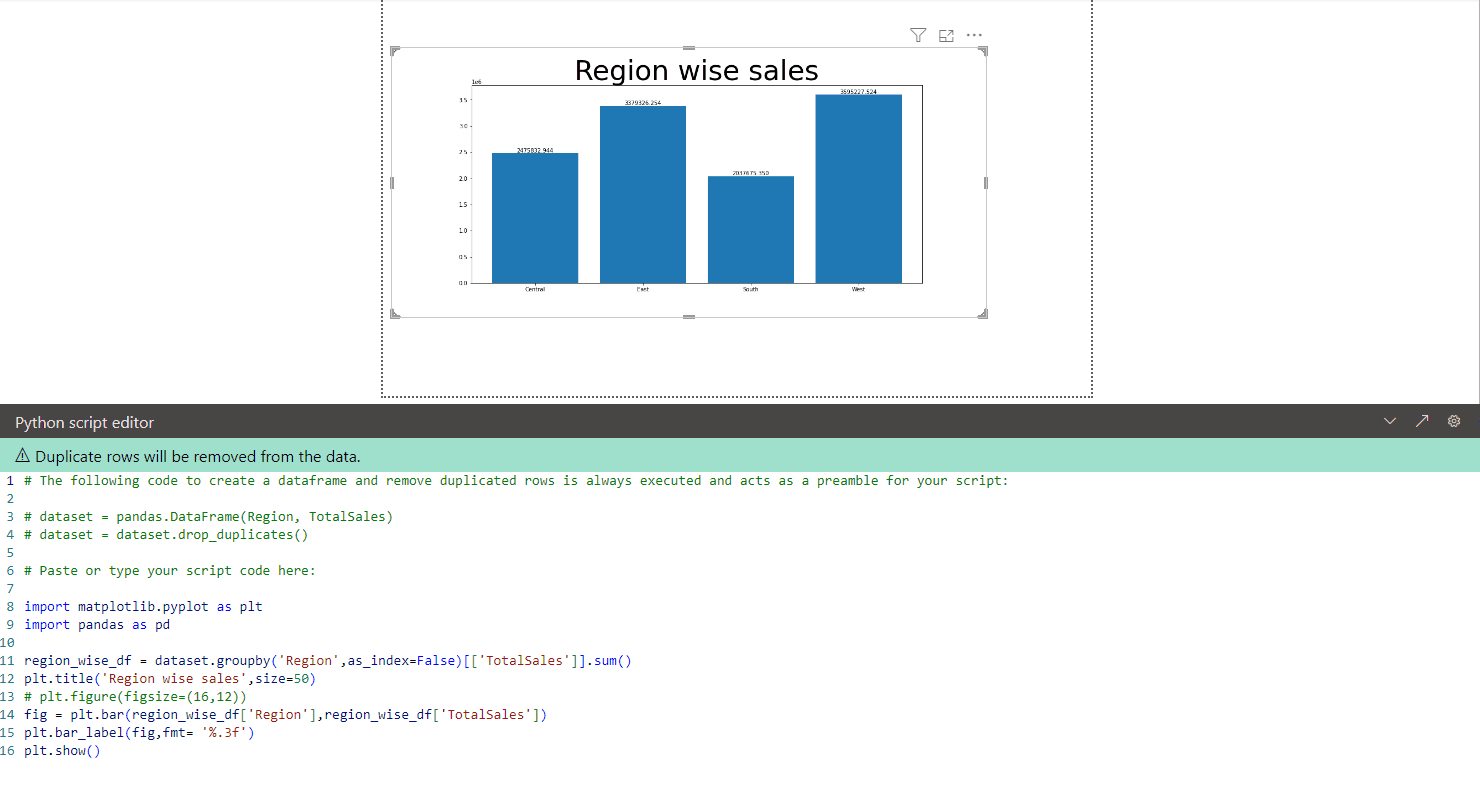
Now we have our data prepared for visualisation.Let’s visualise the Region wise sales using pandas and matplotlib
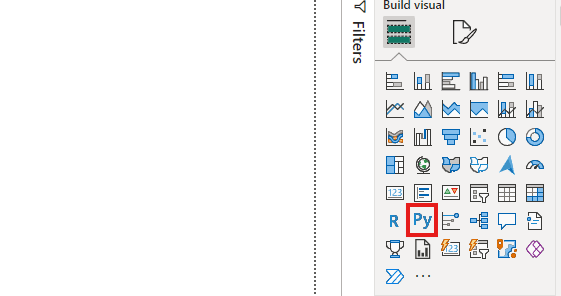
Select python visual from the visualisations pane

A code editor will appear where you can write the python code and create visualisations.For creating the visual , select the columns which we want to use in the visual.

Write the code for grouping the total sales based on region and use matplotlib to visualise the data.

Region-wise sales
.png&w=2048&q=75)
We can create multiple python visuals like this and create a dashboard like this:


Benefits
- DAX language has a steep learning curve compared to python.For a python developer using python inside power BI can be easy .
- Data manipulation - Using python libraries like pandas is easy to group or filter data,thus dashboard development speed can be increased.
- Loading files into powerbi - python can be used to import data into powerbi using python scripts.If any data transformations are required prior to loading the data pandas can be used.
- Using python helps in simplifying complex data transformations .
- Machine learning - python’s scikit-learn library can be used to create machine learning model’s and display the outputs as charts in power bi.
Limitations
- The data python visual uses has a limit of 150000 rows.
- No cross filtering - No cross filtering of visuals is possible in visuals created using python .
- Renaming of input columns is not possible for python visuals.
- If a python visual calculation exceeds 5 minutes,the visual will return an error.
- Performance - When doing complex calculations python can be slower than dax.
- Power BI only supports a limited number of python libraries
- The input data has a limit of size 250 mb when python visual is used
- Visual updates based on filters are slow.