Back
Analytics & BI Dashboards

Exploratory Data Analysis in Power BI

Author
Pfactorial
June 26, 2024
Share
Power BI
Imagine you're standing before a towering bookshelf, its shelves laden with countless books, each packed with information. How do you find the specific book you need without aimlessly wandering through the aisles? That's where a good librarian comes in, guiding you through the maze of books and helping you find your book.

Similarly, in the world of data, exploratory data analysis (EDA) plays the role of the librarian, helping you navigate the vast sea of information and uncover hidden patterns and insights. And when it comes to EDA, Power BI stands as your trusty guide, empowering you to transform raw data into meaningful stories.
Exploratory Data Analysis (EDA) is an iterative process of investigating the properties of a dataset to better understand it. It involves summarising the data, identifying patterns and trends, and detecting outliers. EDA is an essential step in the data mining process, as it helps to ensure that the data is well understood before it is used to build models or make decisions.
EDA Feature implementation in power bi

Data Import and Transformation
Power BI eliminates the complexities often associated with data import and transformation. It seamlessly connects to a wide range of data sources, including databases, spreadsheets, cloud services, and web APIs, making it easy to bring your data into a centralised location. With its intuitive interface and drag-and-drop functionality, transforming data into a format suitable for analysis becomes a breeze. Whether you need to split columns, merge datasets, or perform aggregations, Power BI simplifies the process, ensuring your data is ready for in-depth exploration.

Loading data

Data Cleaning and Preprocessing
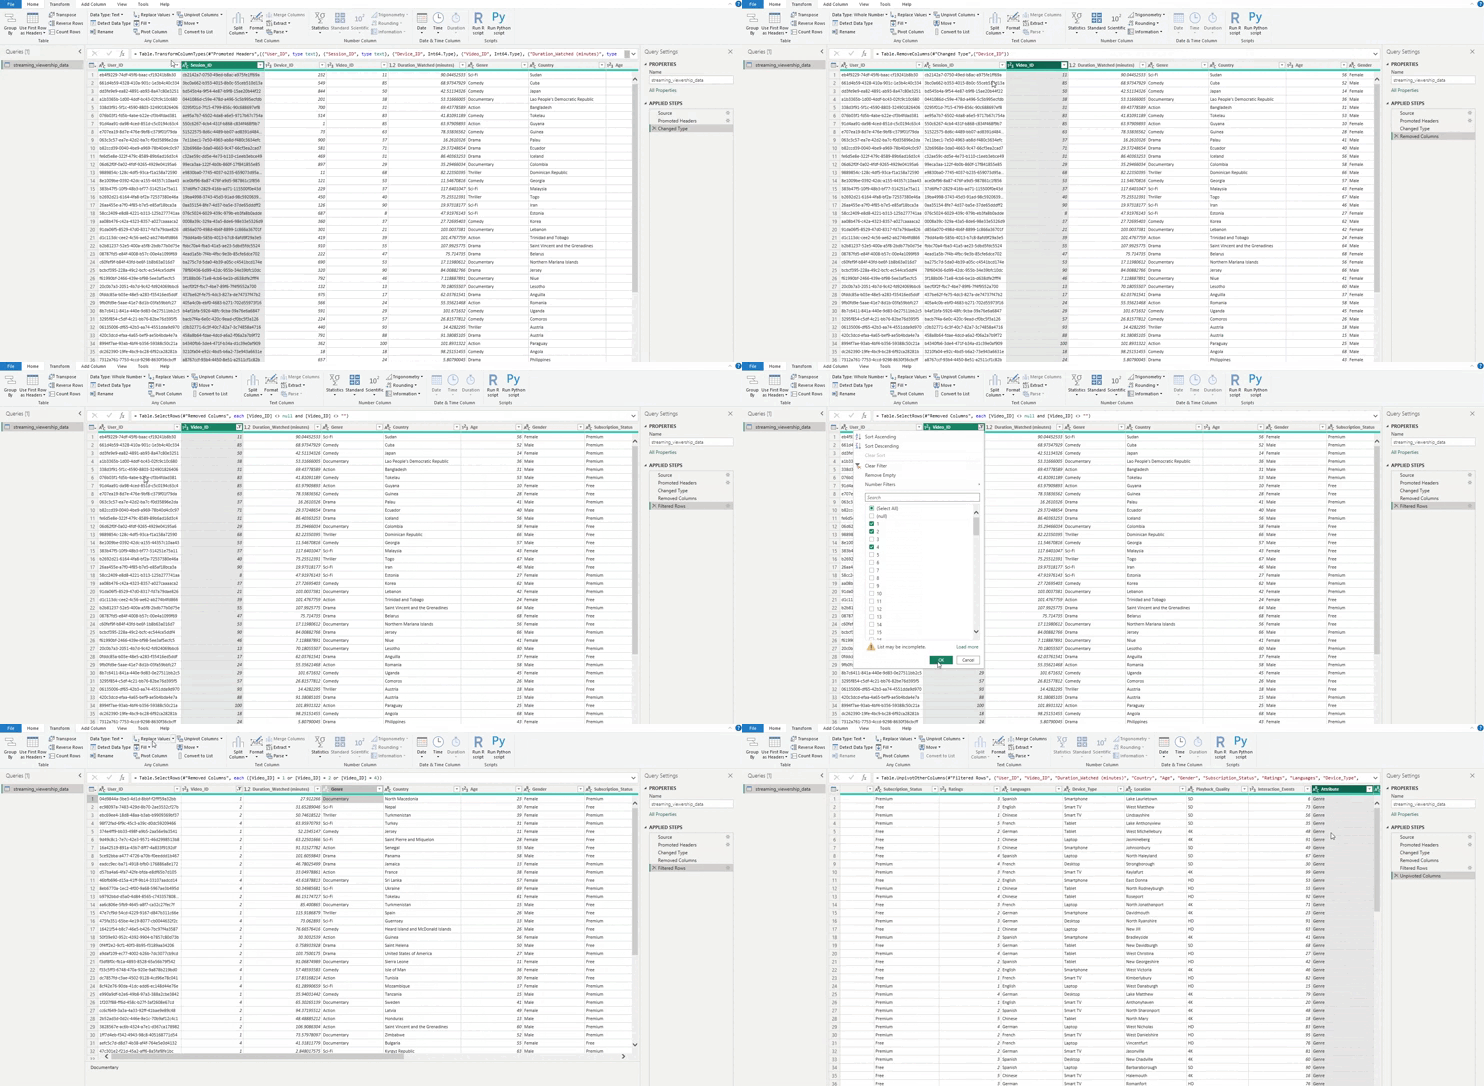
Before embarking on EDA, it's essential to ensure the accuracy and reliability of your data. Power BI acts as your data guardian, helping you identify and address data errors, missing values, and inconsistencies. Its comprehensive data cleaning and preprocessing tools enable you to detect outliers, handle missing data appropriately, and correct any errors that may hinder your analysis. By ensuring the quality of your data, Power BI sets the stage for meaningful insights and reliable conclusions.


data cleaning preprocessing
Data Profiling
Power BI goes beyond basic data cleaning and preprocessing, providing in-depth data profiling capabilities. It examines and summarises the characteristics of your dataset, providing valuable insights into its structure, content, and quality. This comprehensive profiling helps you understand the distribution of values, identify potential data quality issues, and gain a holistic understanding of your data's strengths and weaknesses. Armed with this knowledge, you can make informed decisions about your analysis approach and ensure you're extracting the most value from your data.
Data Profiling
Example: A marketing manager can use Power BI to analyse the distribution of customer demographics, identify outliers in purchase patterns, and assess the completeness of customer contact information.

Interactive Data Visualization
Power BI's interactive data visualization capabilities are a game-changer for EDA. It offers an extensive library of charts, graphs, and maps, allowing you to transform your data into visually appealing and engaging representations. With its drag-and-drop functionality and interactive elements, you can easily create custom visualisations, drill down into specific areas of interest, and filter your data to uncover hidden patterns and trends.

Interactive Data Visualization
Example: A sales representative can use Power BI to create interactive maps that visualise sales territories, identify areas with high sales potential, and track sales performance over time.

Descriptive Statistics
Power BI provides a variety of statistical measures, including mean, median, mode, standard deviation, and quartiles, to help you understand the central tendency and variability of your data. These measures provide a quick overview of your data's distribution and help you identify potential outliers or areas that require further investigation. By summarising your data statistically, Power BI lays the foundation for deeper analysis and informed decision-making.
Descriptive Statistics.

Example: A quality control engineer can use Power BI to calculate the mean, median, and standard deviation of product measurements, identify batches with high variability, and investigate the root causes of product defects

Interactive Data Exploration
Power BI's interactive data exploration features empower you to delve into the details of your data and uncover hidden insights. With its drill-down, filter, and slice capabilities, you can focus on specific areas of interest and explore the nuances of your data. This interactivity allows you to uncover patterns that might not be apparent from static visualisations and gain a deeper understanding of the relationships between different variables.
Interactive Data Exploration

Example: A product manager can use Power BI to drill down into specific product categories, identify customer segments with high satisfaction levels, and investigate the factors that contribute to customer satisfaction.

Anomaly Detection
Power BI goes beyond simply exploring data; it helps you identify potential problems before they arise. Its anomaly detection features utilise statistical methods, machine learning algorithms, and interactive visualisations to pinpoint unusual data patterns that may indicate potential risks or issues. By proactively identifying anomalies, Power BI helps safeguard your organisation from potential financial losses, security breaches, or operational disruptions.
Anomaly Detection power bi

Example: A fraud detection specialist can use Power BI to identify anomalies in transaction patterns, detect potential fraudulent activities, and protect their customers from financial losses.

These examples illustrate how Power BI's comprehensive EDA capabilities empower data analysts and business users to gain deep insights from their data, driving informed decisions and improving business outcomes.
Benefits of Using Power BI for EDA:
Ease of Use and Accessibility
Intuitive Interface: Power BI's intuitive interface, characterised by drag-and-drop functionality and clear navigation, makes it easy for data analysts of all skill levels to effectively navigate the tool and perform various EDA tasks.

Self-Service Capabilities: Power BI's self-service capabilities enable business users to independently perform EDA tasks, reducing the reliance on data analysts for basic data exploration and visualization. This empowers business users to gain quick insights into their data, identify trends and patterns, and make informed decisions in a timely manner.

Comprehensive Feature Set for EDA
Data Import and Cleaning: Power BI seamlessly connects to a wide range of data sources, including databases, spreadsheets, cloud services, and web APIs. It also provides tools for identifying and addressing data errors, missing values, and inconsistencies, ensuring the accuracy and reliability of data before embarking on analysis.

Data Profiling and Visualization: Power BI's data profiling capabilities enable users to examine and summarise the characteristics of a dataset, providing valuable insights into its structure, content, and quality. It offers an extensive library of charts, graphs, and maps, allowing users to transform their data into visually appealing and engaging representations.

Descriptive Statistics and Interactive Exploration: Power BI provides a variety of statistical measures, including mean, median, mode, standard deviation, and quartiles, to summarise and understand the central tendency and variability of data. Its interactive visualisations allow users to drill down, filter, and slice data to focus on specific areas of interest, enabling them to uncover hidden patterns and insights.

Effective Communication and Informed Decision-Making
Visual Storytelling: Power BI's storytelling capabilities enable business users to create compelling data stories that effectively communicate insights to stakeholders. These data stories combine visuals, text, and interactive elements to present insights in a clear and engaging manner, facilitating informed decision-making across the organisation.

Integration with Other Tools: Power BI integrates with other data analysis tools, such as Python and R, allowing for seamless data exploration and analysis. This integration enables analysts to leverage advanced statistical techniques and perform complex analyses, streamlining the overall EDA process.

Conclusion
Power BI is a powerful and versatile tool for Exploratory Data Analysis (EDA). Its ease of use, comprehensive features, and stunning visualisations make it an invaluable asset for data analysts and business users alike. Whether you're just starting out with EDA or you're a seasoned data analyst, Power BI can help you gain deeper insights from your data and make informed decisions that drive positive outcomes.
DISCOVER MORE. CONNECT WITH US!

Intrigued by what you have read? Dive deeper and stay ahead with the latest insights and trends. We are here to answer your questions and help you explore further.