Back
Analytics & BI Dashboards

Augmented Analytics

Author
Pfactorial
June 26, 2024
Share
Augmented analytics intro
Introduction
Everywhere we know that business teams are hungry for analytics. In an era where data is abundant and diverse, businesses have come to recognize the potential that lies within their data streams. They crave the ability to transform raw data into accurate forecasts and predictions that serve as reliable compasses guiding their decision-making processes. This quest for data-driven decision-making has given rise to the field of augmented analytics. This is why we are seeing a new wave of disruption in data analytics tools with the concept of augmented analytics gaining momentum.
Augmented analytics intro
What is Augmented Analytics
Augmented analytics is the use of enabling technologies such as machine learning and AI to assist with data preparation, insight generation and  explanation to augment how people explore and analyse data in analytics and BI platforms. It also augments the expert and citizen data scientists by automating many aspects of data science, machine learning, and AI model development, management and deployment.
Augmented Analytics can be broken down into :
Data Integration and Preparation
Augmented analytics starts with gathering data from various sources and transforming it into a usable format. This streamlines the data wrangling process, saving time and effort
Machine learning(ML)
Machine learning algorithms play a pivotal role in augmented analytics. They automatically analyze data, identify patterns, and make predictions without the need for manual programming, providing more accurate insights.
Natural Language Processing (NLP)
NLP enables users to interact with data in plain language, making it accessible to non-technical users. You can ask questions or issue commands, and the system responds accordingly.
Data Visualization and Exploration
Augmented analytics tools include data visualization features, helping users understand data patterns quickly through interactive charts, graphs, and dashboards
Augmented analytics tools
Augmented analytics tools are infused with AI and machine learning capabilities. Here will discuss the  top 2 most popular augmented analytics tools.
Oracle Analytics Cloud
Oracle Analytics Cloud (OAC) is a comprehensive cloud-based analytics platform offered by Oracle Corporation. It is designed to empower organisations with powerful tools for data analysis, data visualisation, and business intelligence. OAC enables businesses to make informed decisions by extracting valuable insights from their data, regardless of where that data resides.
Power BI
Power BI is a robust and widely-used business intelligence (BI) and data visualization tool developed by Microsoft. It empowers organizations to analyze data, gain insights, and make data-driven decisions.
Machine learning with PowerBI
As a data analyst we can now leverage the power of Artificial Intelligence  and Machine Learning within Power BI. We can create machine learning models to predict future data that will help us in business decisions.
Let us  Explore the Step-by-Step Process of Building a Prediction Model in Power BI

Log in to PowerBI Service
In Power BI, automated machine learning is considered an advanced feature, typically requiring a premium licence. However, if you do not have one, Power BI offers a generous 60-day trial that includes access to all features. Let's go through the steps to obtain a trial version of Power BI Service. To begin, you'll need to create a Microsoft account, which you can do by visiting the following link:  https://account.microsoft.com/account/manage-my-account. Once you have your Microsoft account, you can log in to Power BI Service by following this link: https://app.powerbi.com/
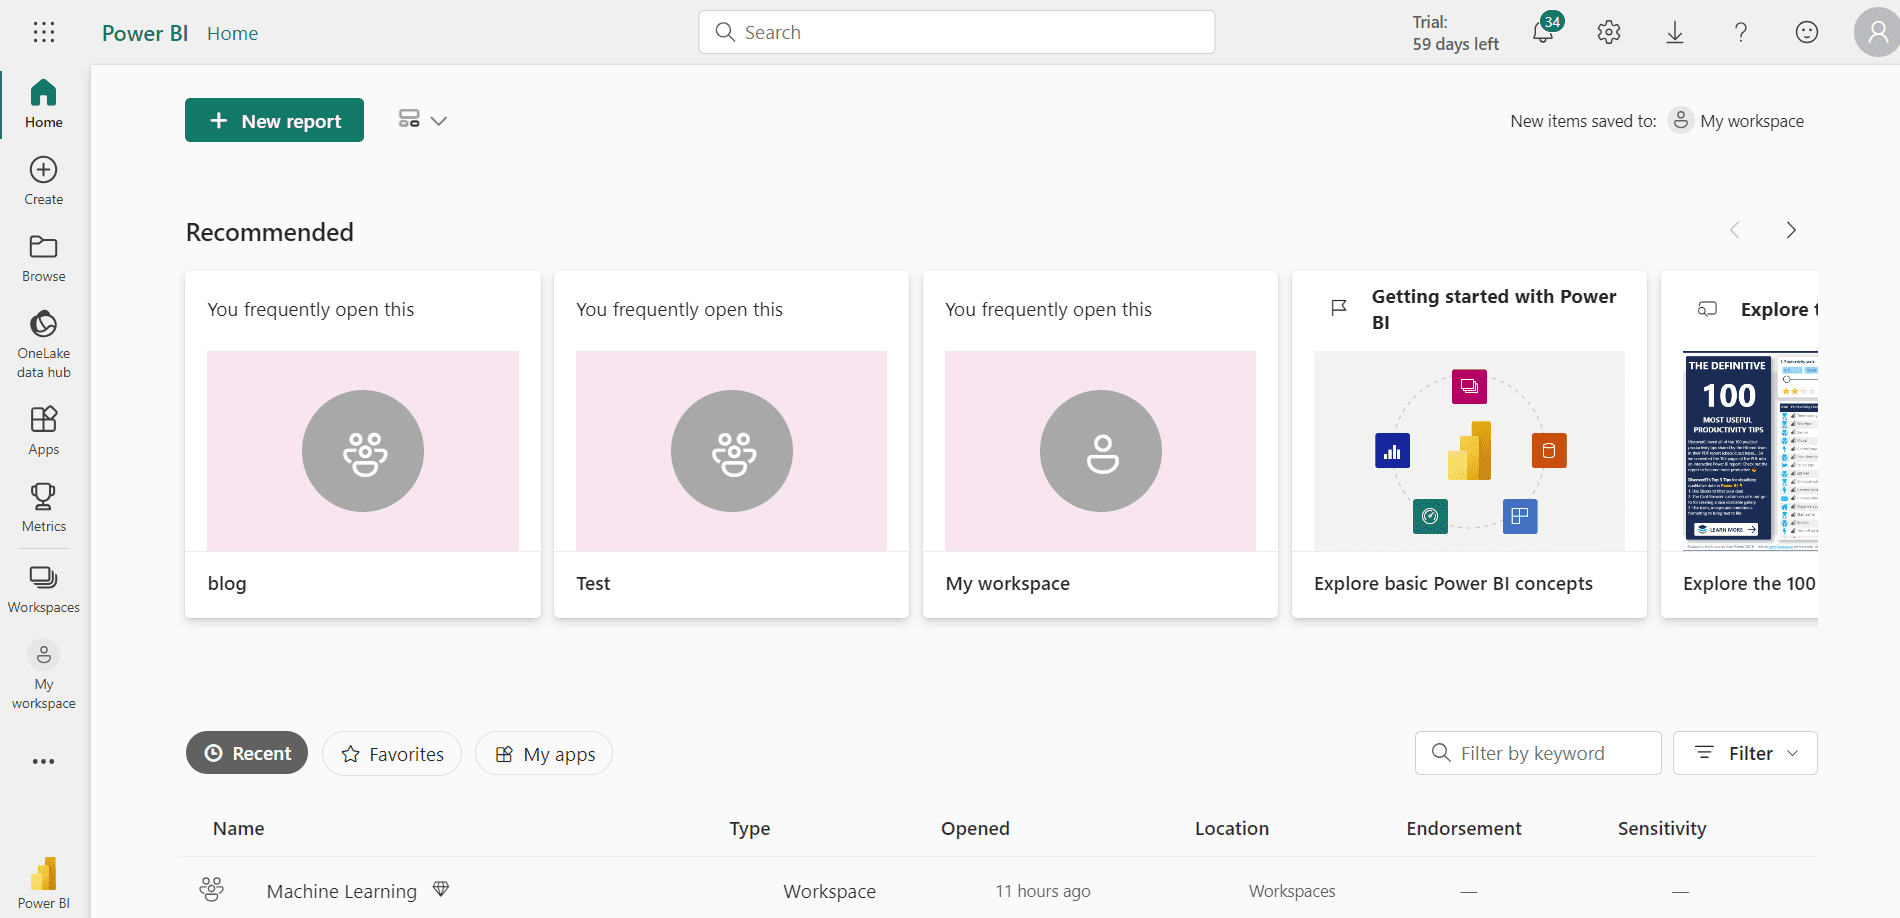
Now you will be in Power BI Service
augmented analytics picture1
Create workspace
Select workspaces in the Power BI left navigation pane and click New workspace. In the create work space panel enter a work space name and click apply.
Create dataflow in new workspace
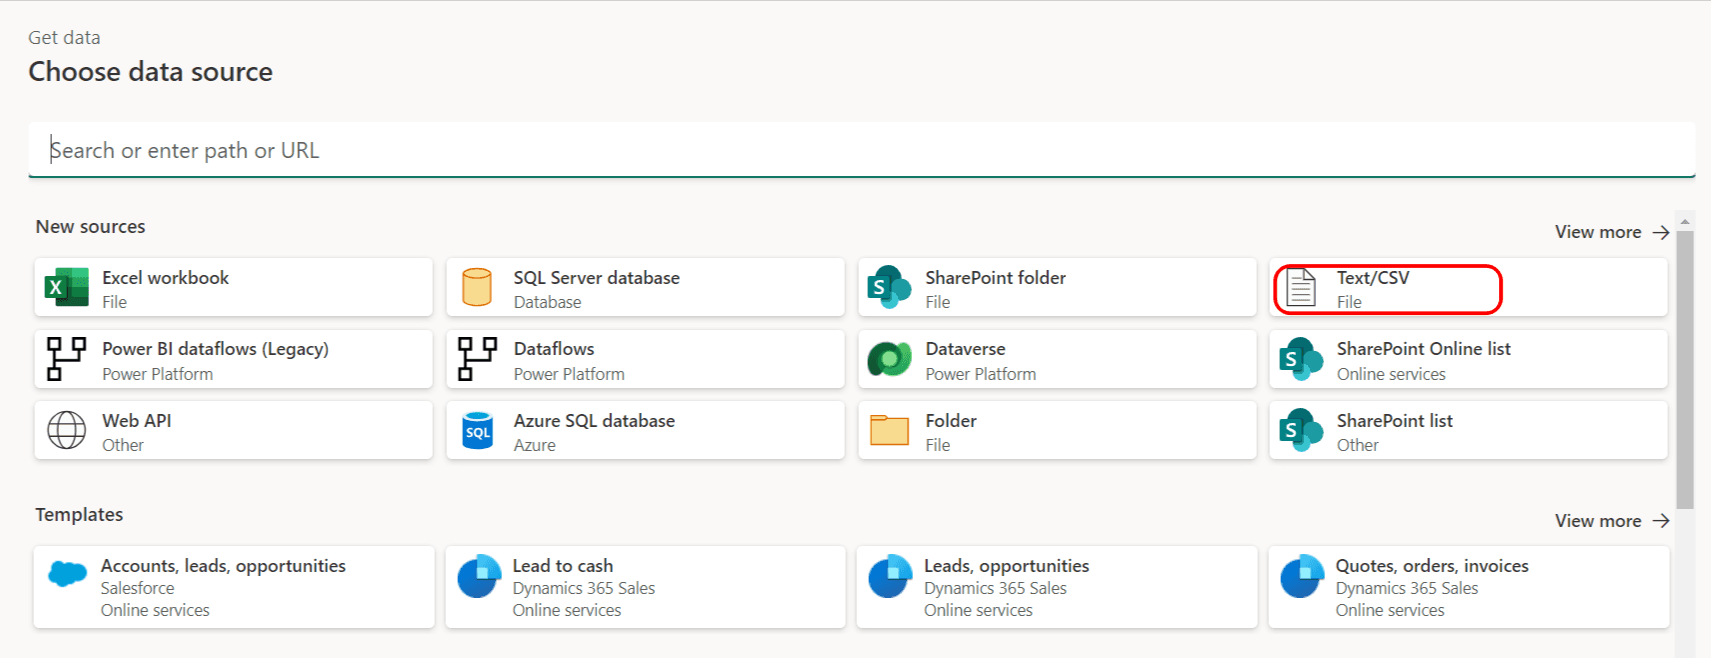
In the workspace click new and dataflow. In the new window click Add new tables. Then choose a data source. Here we are using Text/CSV
Augmented analytics
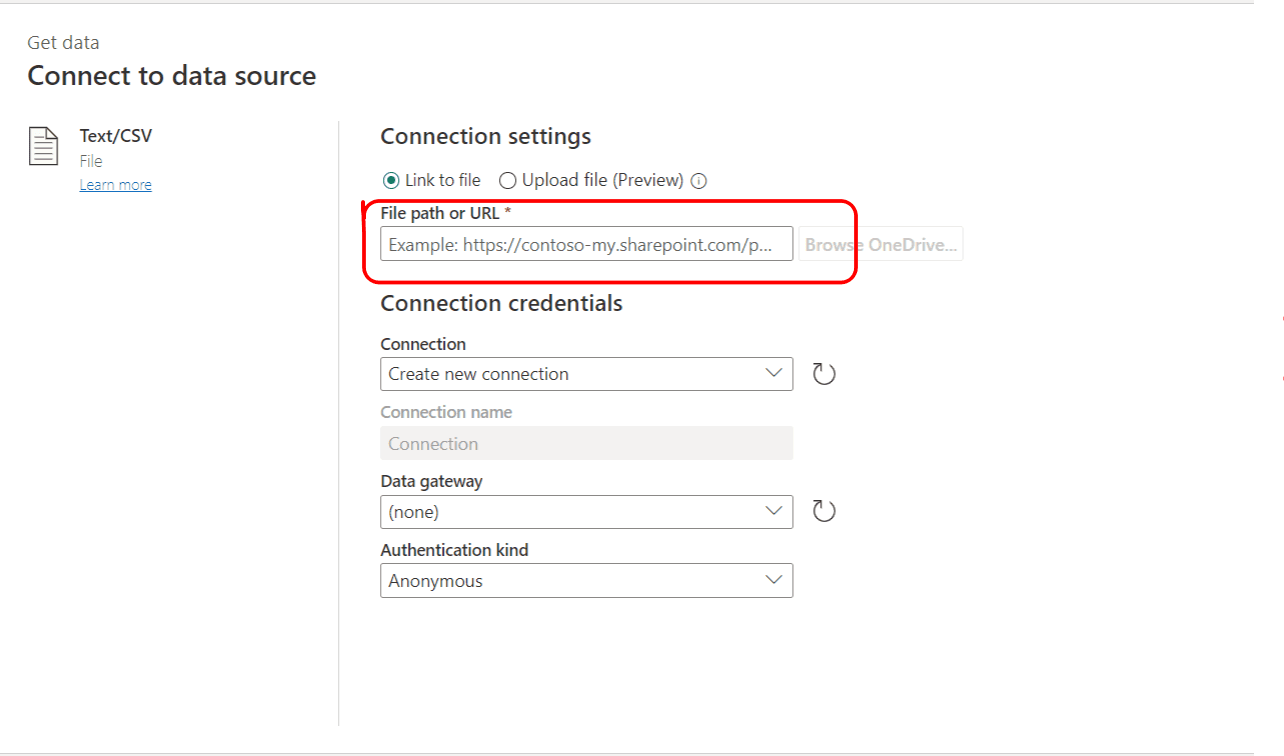
Then you will reach  a window like this. Here you can give a file path or URL. To upload a file you need a sufficient license for OneDrive. You need an account in Microsoft 365.  Here we are using GitHub Link.   provide the link and click next.
Augmented analytics
Let us discus how to create a Github link
Select a dataset. Here we are using bikerental dataset from kaggle. This dataset contains the daily count of rental bikes between the years 2011 and 2012 . we split the dataset to two by year. Our training dataset contains 2011 data and the test dataset contain 2012 data. Remove the target column(Count column) in the test data set . create a github repo and upload both datasets. Then click in Raw and collect the link. Link should be like this
After giving the link you can see the preview page and click Transform data. Then in power query you can change data types of your data. Here in this data set all are correct, no need to transform. Then click save and close. Then give a name to your data flow. By clicking add tables we can add test data in the same way mentioned above
Build machine learning model
Now we have train and test data in our dataflow and we can create a machine learning model using train data. Click on the brain symbol(Apply ML model) of train data.
Augmented analytics
Give table name(Here train data), and outcome column. (Here it is cnt) and click Next.
augmented analytics picture4
Then Choose a model. Power BI automatically suggests a suitable model. There is an option to choose a different model. Then click Next.
Augmented analytics
Select the columns to train the data. Here Power BI gives correlation details.(high or low). Then click Next.
Augmented analytics
Give a name to the model . set training time. Power BI automatically suggests a training time. Then click Save and train. Power bi splits the training data to train and test and evaluate the result.
Augmented analytics
Augmented analytics
Now it is in training mode when the training completes it will add date and time of last training. We can see the report by clicking view training report
Augmented analytics
augmented analytics result
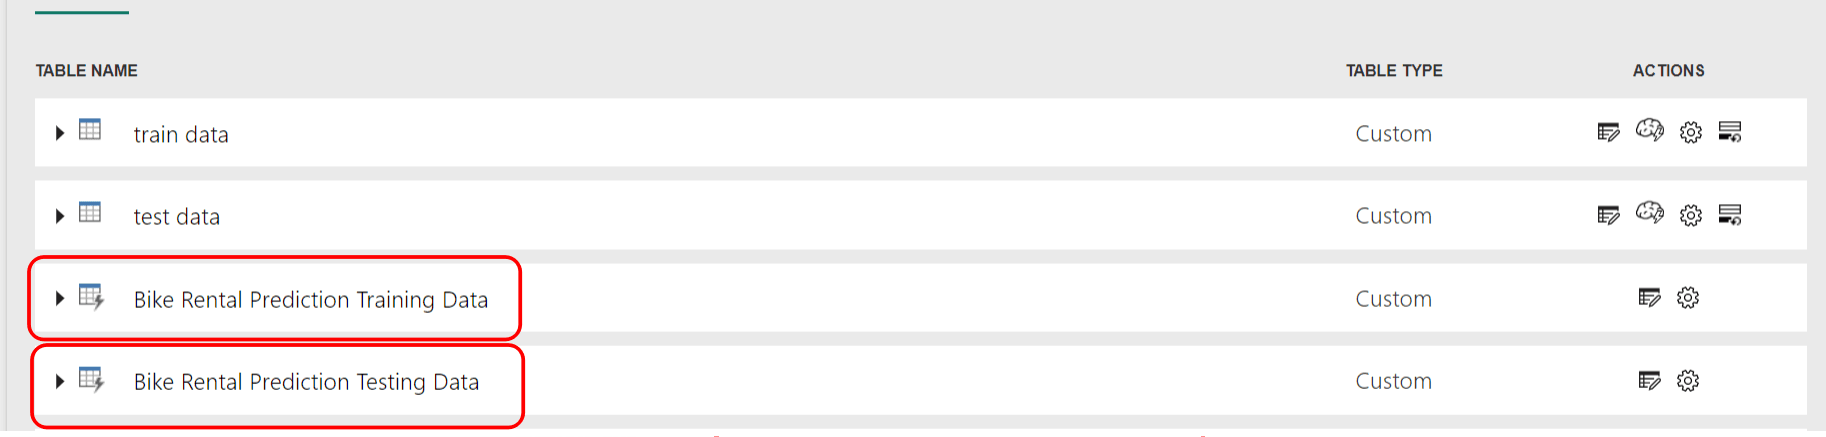
We can apply this model to test data. Click save and apply. We can edit the output column name. Then two files are created in our workspace. It contains model performance and training details of model. Inside dataflow two more tables are created open test data enriched Bike Rental Prediction. In these tables there will be three more rows . Bike Rental Prediction ExplanationIndex, Bike rental Prediction. Regression Result ,Bike Rental Prediction. Regression Explanation
Augmented analytics
Connect with PowerBI Desktop
Certainly, now that we have the test dataset containing our projected bike rental counts for 2012, we can create visual representations of our predictions. This visualization will not only enhance our comprehension but also simplify the decision-making process.
To create visualization we have to upload data to the Power BI desktop from dataflow. Open Power BI Desktop In Home tab click Get data and Dataflows.
Choose the prediction table and then click on the "Load" option. The preview of the data will appear on the right-hand side. If you happen to encounter any empty tables in the preview, you can resolve this by refreshing the data within Power BI Service and then reconnecting it with the dataflow. This action will result in the successful loading of the data into Power BI Desktop.
Augmented analytics
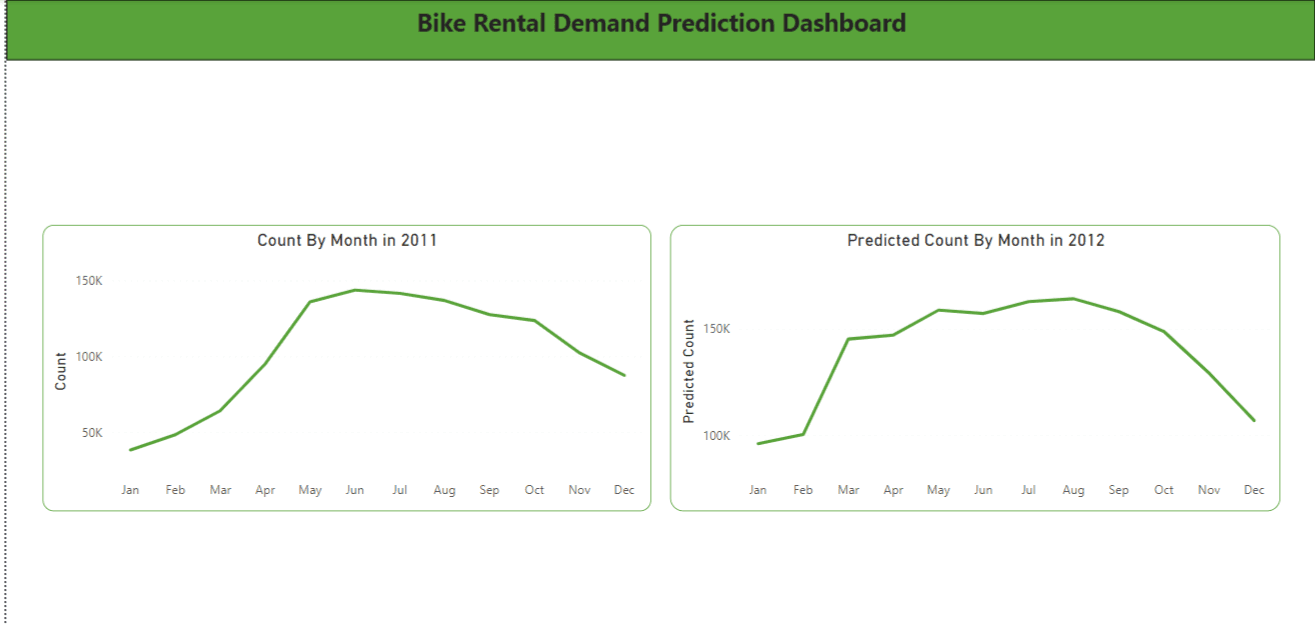
Load our training data into Power BI. With this data now available, you can proceed to generate the visualizations you require using Power BI's capabilities. This dashboard provides a side-by-side comparison between the bike rental counts in 2011 and the projected counts for 2012. By examining this comparison, we can readily assess the expected demand for bike rentals in 2012.
augmented analytics graph
Augmented Analytics: Real-World Applications
Let's explore how different industries are leveraging augmented analytics to enhance their decision-making processes:
  1. Financial Services
  2. Helping financial institutions make smarter, data-driven decisions, improve risk management, and enhance customer experiences.
    Risk Assessment: Analyzing historical and real-time data to assess credit, market, and operational risk.
    Fraud Detection: Detecting fraudulent activities by analyzing transaction patterns and user behavior.
    Customer Insights: Gaining a deeper understanding of customers to personalize offers and improve retention.
  3. Manufacturing and retail:
  4. Predictive Maintenance: Predicting machinery failures to schedule proactive maintenance and reduce downtime.
    Supply Chain Optimization: Analyzing supply chain data to optimize inventory and meet customer demands efficiently.
    Inventory Management: Optimizing inventory levels and pricing to reduce costs and stockouts.
  5. Healthcare
  6. Patient Data Analysis: Identifying trends, anomalies, and health risks in patient data for early disease detection.
    Hospital Operations Optimization: Optimizing resource allocation and patient flow for improved efficiency.
  7. Augmented analytics offers several benefits
  • Agility: Accelerating the entire data analysis process for quick decision-making.
  • Time Savings: Automating data preparation and analysis, allowing employees to focus on strategic tasks.
  • Accuracy: Providing comprehensive, bias-free insights through AI and ML.
  • Increased Efficiency: Boosting operational efficiency through automation.
  • Democratized Data Access: Making data and insights accessible to a wider range of employees.
  • Cost Savings: Streamlining operations and reducing errors for cost-efficiency.
The impact of augmented analytics extends beyond mere data analysis; it's reshaping decision-making paradigms. When effectively integrated, it promises to revolutionize business operations.
DISCOVER MORE. CONNECT WITH US!

Intrigued by what you have read? Dive deeper and stay ahead with the latest insights and trends. We are here to answer your questions and help you explore further.