Back
Healthcare & Clinical

Mapping Genetic Risk Factors for Renal Cell Carcinoma from a 1,600-Patient Cohort

How Pfactorial Technologies built a statistical and machine-learning pipeline that narrowed 603 candidate genetic variants down to validated, adjusted risk markers for kidney cancer.

August 21, 2026
Share
ENGAGEMENT SNAPSHOT

Pfactorial_Case_Study_Genetic_Risks_Kidney_Cancer image 1
Figure 1 - Key figures from this engagement, at a glance.
EXECUTIVE SUMMARY
Renal cell carcinoma (RCC) risk is driven by a mix of environmental and genetic factors, and our client wanted to understand which genetic variants - single nucleotide polymorphisms, or SNPs - actually contribute to that risk in a way that could inform precision-medicine screening.
Public databases point to hundreds of SNPs with a plausible biological link to RCC, but only a small fraction are both reliably measurable and genuinely predictive once confounding factors are accounted for. Testing dozens of variants independently also inflates false positives unless corrected for.
Pfactorial built a pipeline that shortlisted 603 candidate SNPs down to 73 genotyping-feasible variants across 13 cancer-relevant genes, tested them with FDR-corrected univariate and confounder-adjusted multivariate models, and benchmarked eight predictive modeling approaches to turn the surviving associations into a usable risk model.
Why this engagement is representative This engagement demonstrates a specific Pfactorial capability: taking a client from “which genetic variants might matter” to a confounder-adjusted, benchmarked risk model - with the statistical rigor a precision-medicine program can actually build on.
THE CHALLENGE
The client had a clear research question and a data-quality and statistical-rigor problem standing between raw genomic data and a defensible answer.

1. Thousands of candidate variants, a handful of real signals

Public databases point to hundreds of SNPs with a plausible link to RCC, but only a fraction are both measurable on the study's genotyping platform and genuinely predictive.

2. Multiple testing inflates false positives

Testing 73 SNPs independently without correction would flag associations that are statistical noise, not biology - false discovery rate correction was non-negotiable.

3. Confounders can masquerade as genetic risk

Age, gender and ethnicity all correlate with RCC risk independently of genetics, and can distort a SNP's apparent effect if a model doesn't adjust for them.

4. A single-variant view misses combined effects

Some genetic risk may come from how variants interact with each other, not just their individual presence - a purely univariate analysis would miss that entirely.
The real brief Not “run a GWAS and report p-values” but “build a defensible, confounder-adjusted risk model a precision-medicine program could actually build a screening tool on.”
THE SOLUTION
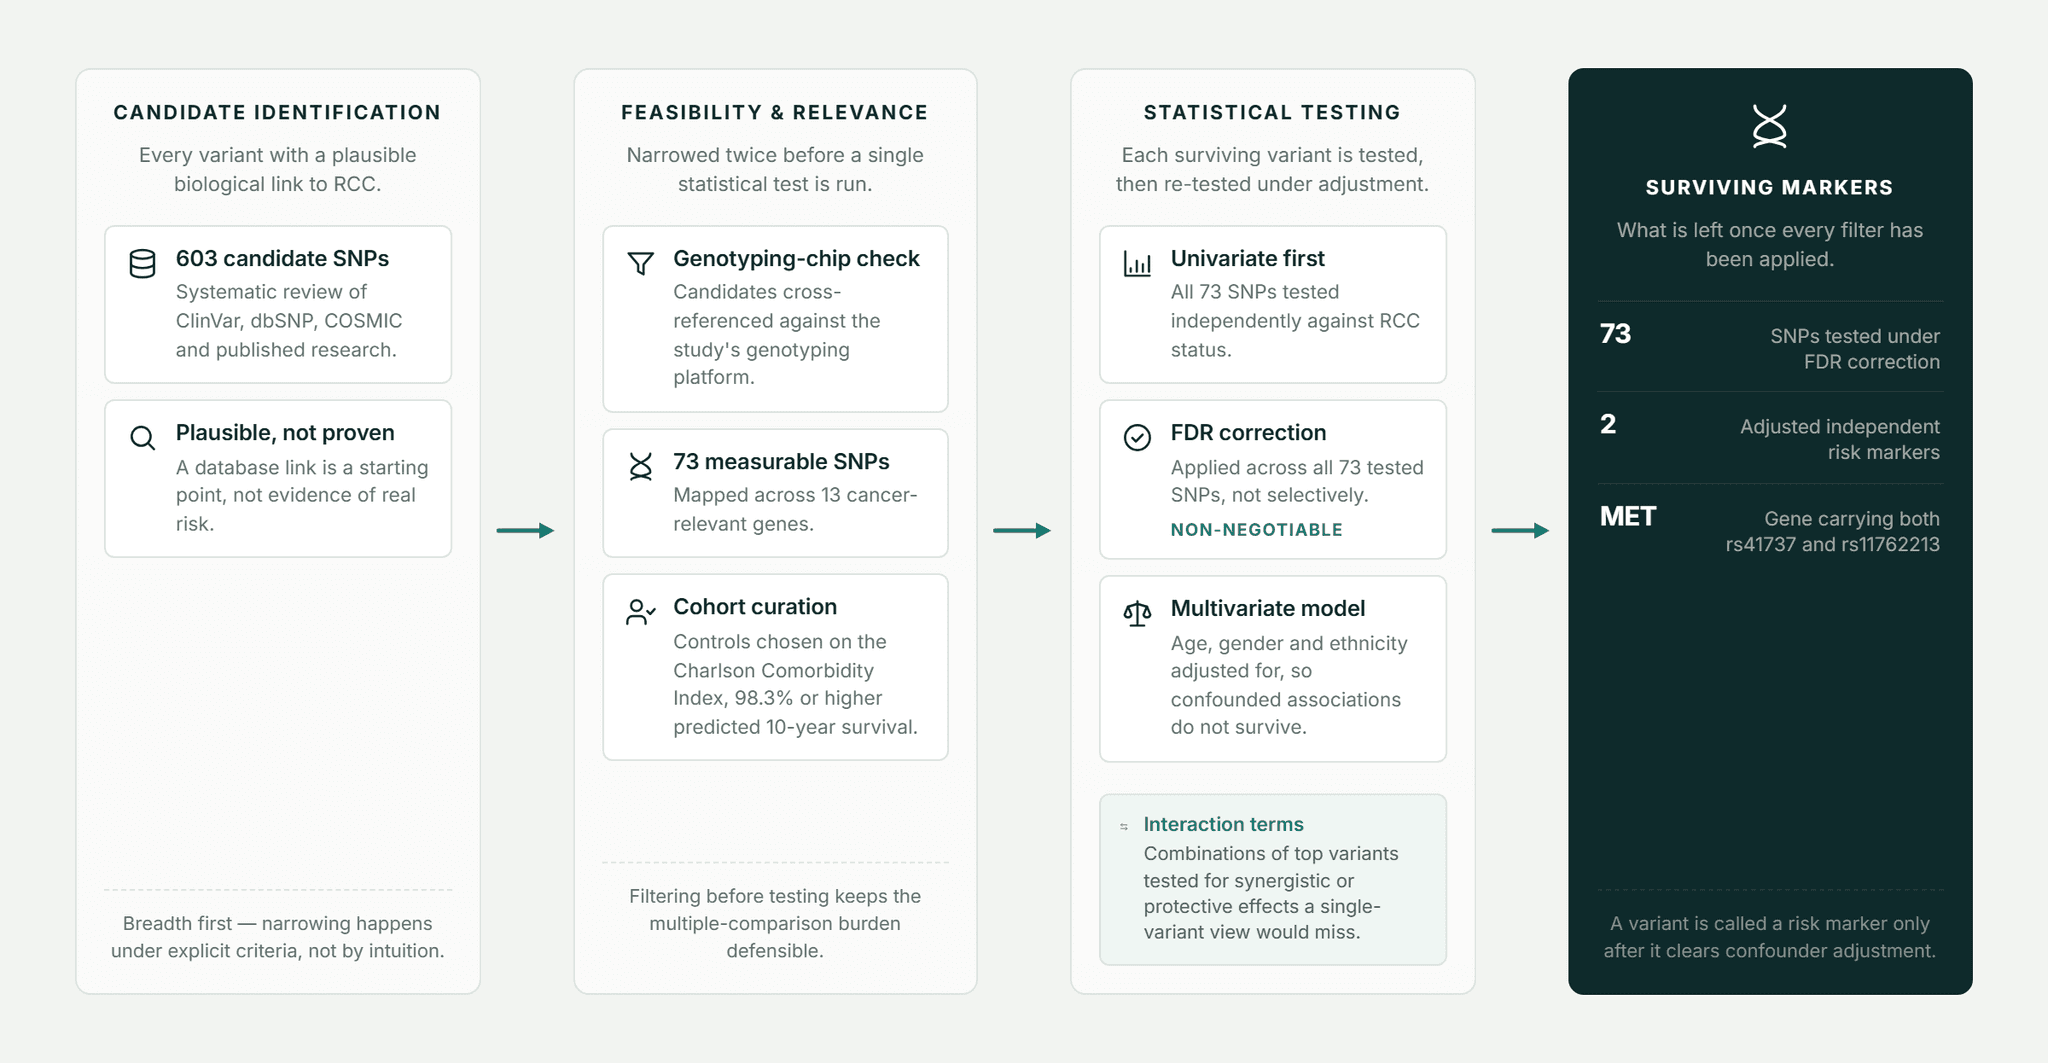
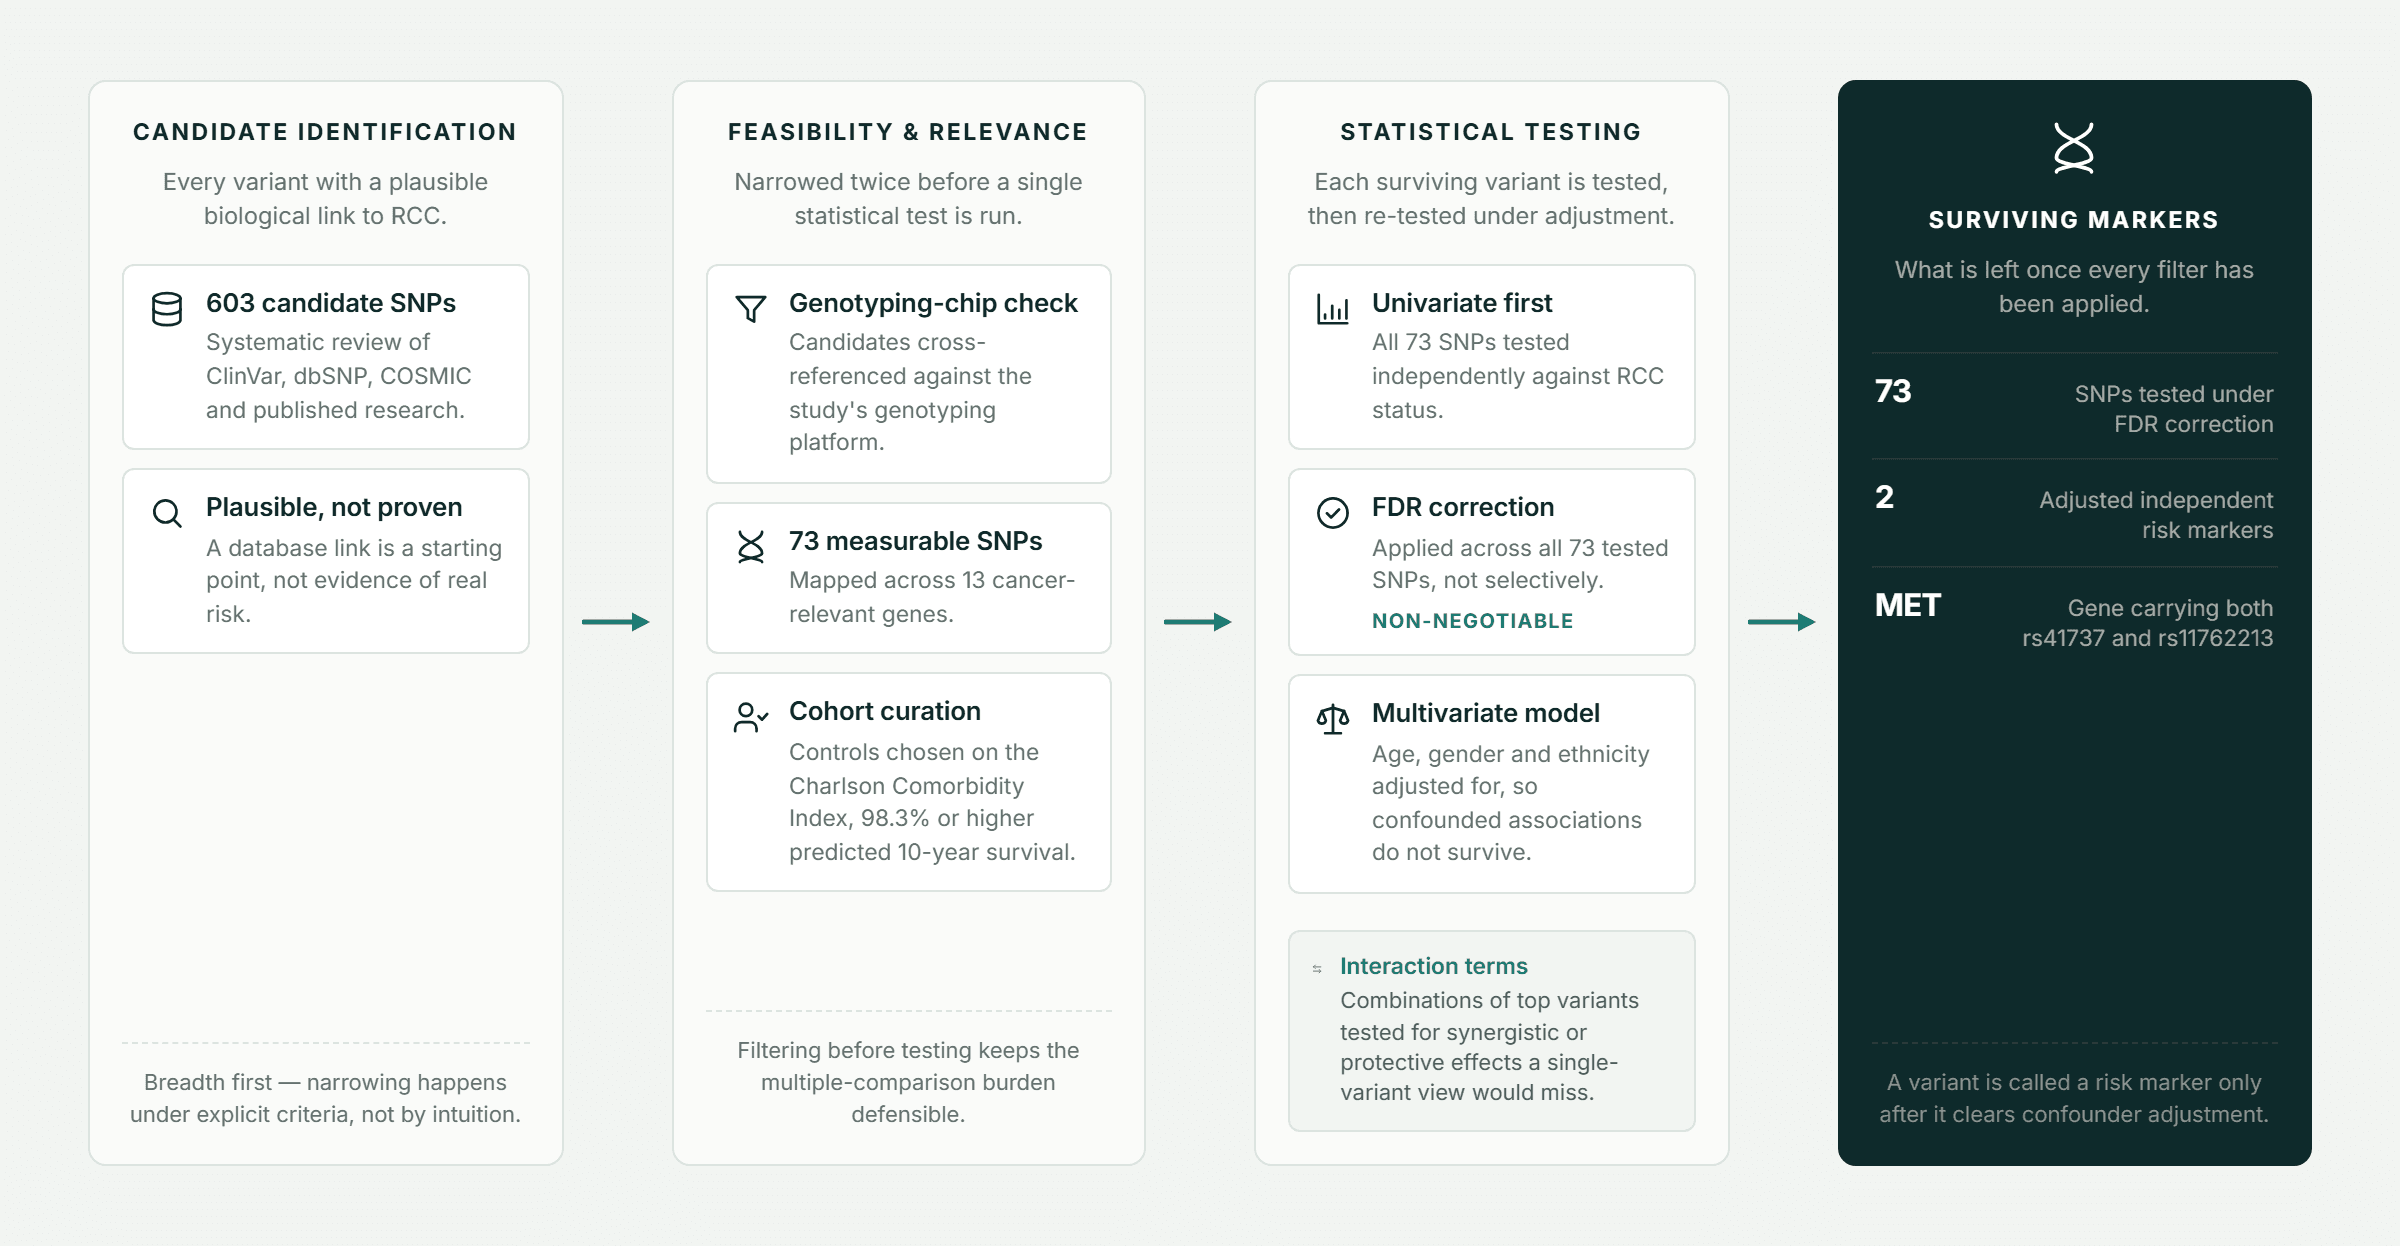
Pfactorial built a progressive filtering and validation pipeline: candidate SNPs were narrowed by feasibility and relevance before any statistical testing began, and every surviving association was adjusted and benchmarked before being called a risk marker.
Pfactorial_Case_Study_Genetic_Risks_Kidney_Cancer image 2
Figure 2 - 603 candidate variants narrowed to validated, independent risk markers.

Architectural principles

  • Progressive filtering - An initial list of 603 candidate SNPs, drawn from ClinVar, dbSNP, COSMIC and published research, was narrowed to 73 genotyping-chip-measurable variants across 13 cancer-relevant genes before any statistical testing began.
  • Univariate first, multivariate to confirm - Each SNP was tested independently first, then re-tested in a multivariate model adjusted for age, gender and ethnicity, so confounded associations didn't survive to the final result.
  • Correct for multiple comparisons - False discovery rate correction was applied across all 73 tested SNPs, keeping the list of “significant” findings statistically honest rather than inflated by chance.
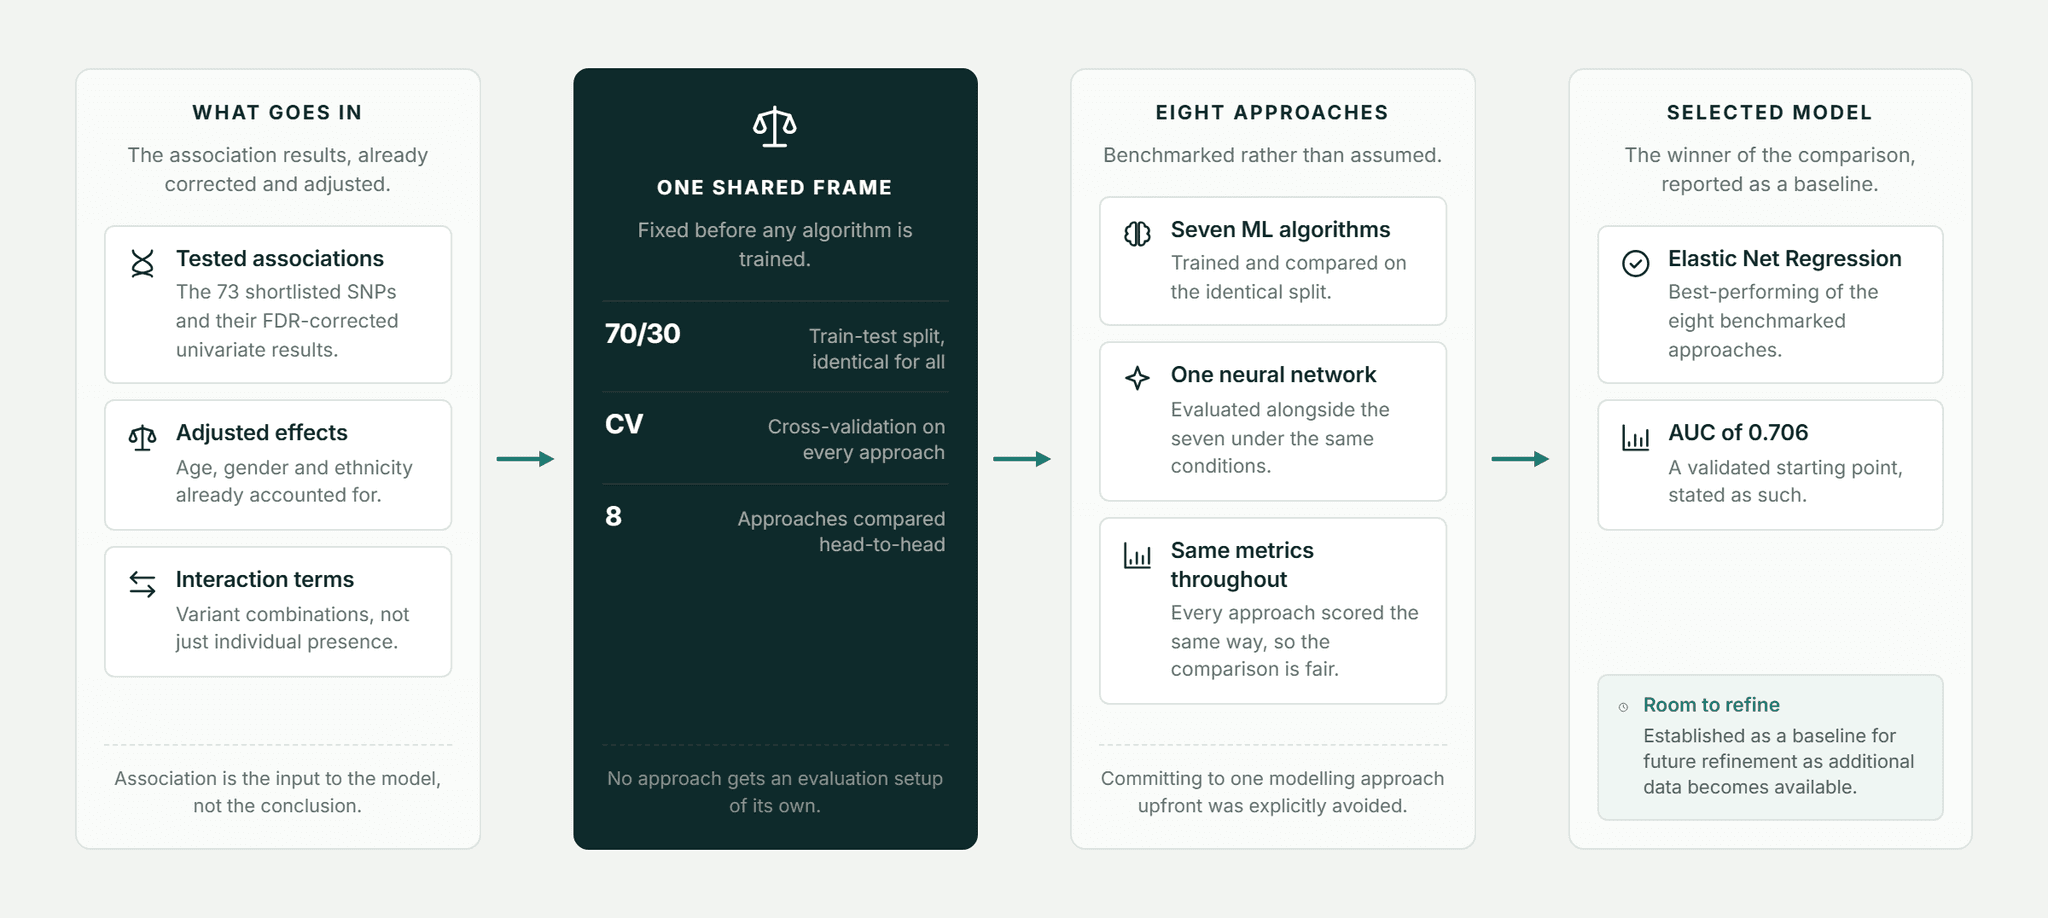
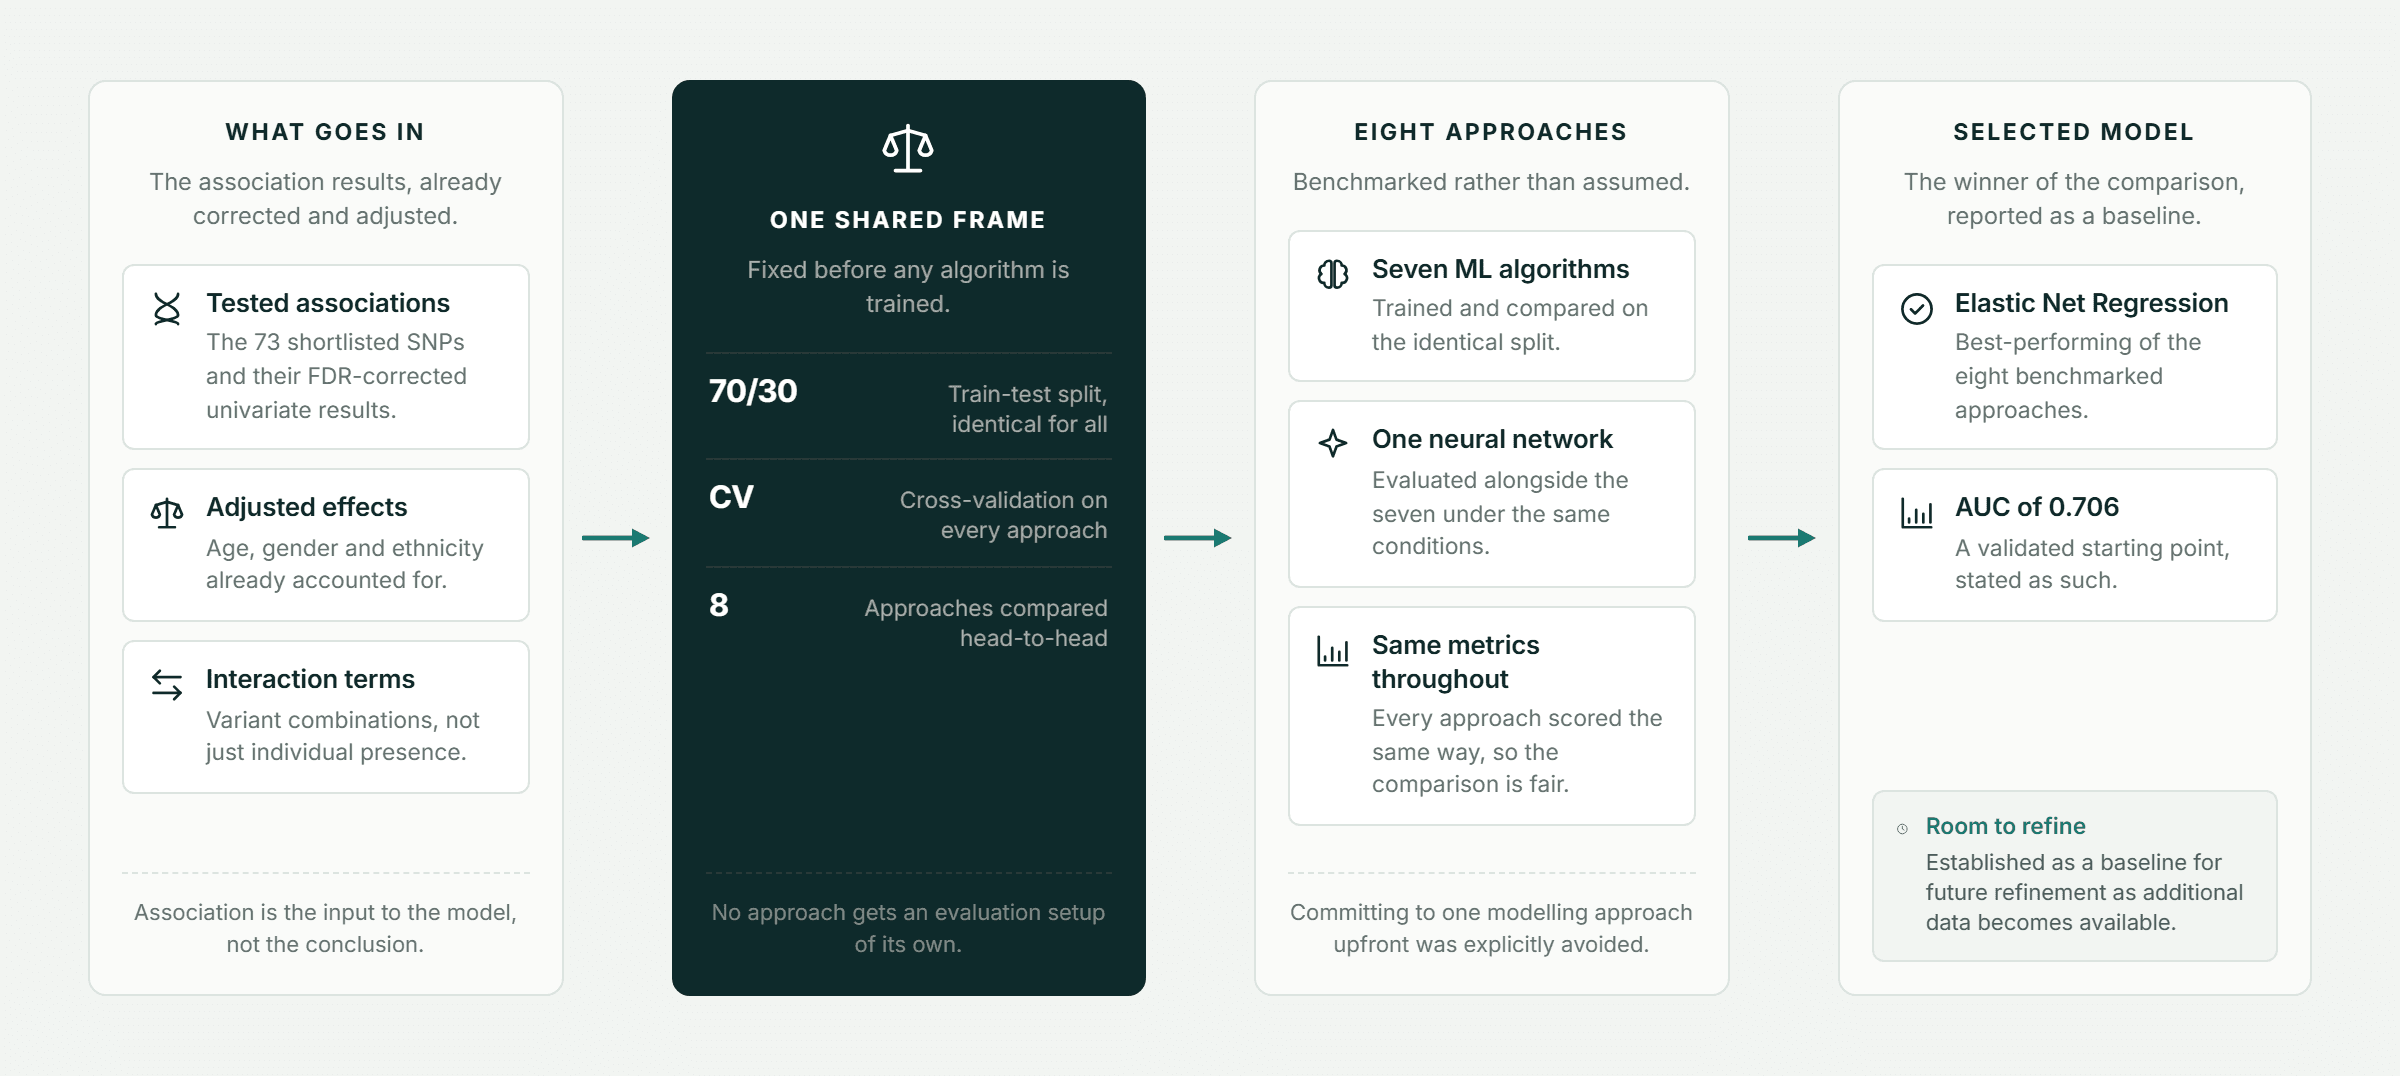
  • Benchmark, don't assume - Seven machine learning approaches plus a neural network were trained and compared head-to-head on the same train/validation split, rather than committing to a single modeling approach upfront.
CAPABILITIES DELIVERED
Each deliverable narrows the prior stage's findings under progressively stricter statistical scrutiny.
CAPABILITY
WHAT IT DOES
Candidate SNP shortlist
603 candidate variants narrowed to 73 genotyping-feasible SNPs across 13 relevant genes.
Univariate association testing
FDR-corrected independent testing of all 73 shortlisted SNPs against RCC status.
Multivariate logistic regression
Adjusted for age, gender and ethnicity to isolate independent genetic effects.
Variant-variant interaction analysis
Tested whether combinations of SNPs amplify or offset individual risk effects.
Benchmarked predictive model
Eight ML/NN algorithms compared on a 70/30 train-test split with cross-validation.
Documented cohort methodology
Demographics and selection criteria characterized for reproducibility.
Pfactorial_Case_Study_Genetic_Risks_Kidney_Cancer image 3
Figure 3 - From single-variant association to a benchmarked predictive model.
Design note Finding a statistically significant SNP is step one, not the finish line. The value is in confirming the association survives confounder adjustment and holds up against seven other modeling approaches before anyone calls it a risk marker.
ENGINEERING FOR SCALE AND RELIABILITY
Six methodological decisions separate a defensible risk model from an unvalidated list of significant-looking SNPs.

Rigorous cohort curation

Controls were selected using the Charlson Comorbidity Index to ensure a predicted 10-year survival probability of 98.3% or higher, producing a defensible comparison group.

Three-stage SNP shortlisting

Literature and database review, genotyping-chip feasibility cross-reference, and gene-relevance mapping - each stage narrowing the candidate list before statistical testing began.

FDR correction across all tested variants

False discovery rate correction was applied consistently across all 73 tested SNPs to control for the inflated false-positive risk of multiple simultaneous tests.

Multivariate confounder adjustment

Age, gender and ethnicity were included in the regression model to isolate each SNP's independent effect from demographic correlation.

Interaction-term modeling

Logistic regression with interaction terms tested whether variant combinations produced synergistic or protective effects beyond their individual associations.

Head-to-head model benchmarking

Eight predictive approaches were evaluated under an identical 70/30 train-test split, so the final model choice was evidence-based rather than a default pick.
DELIVERY APPROACH
The engagement moved from broad candidate identification to a validated, benchmarked risk model in clearly sequenced stages.
1. SNP candidate identification - systematic review of public databases and published research to build the initial 603-variant candidate list.
2. Genotyping feasibility filtering - cross-referencing candidates against the study's genotyping platform, narrowing to 73 measurable SNPs.
3. Cohort curation & characterization - case and control selection with documented demographic and comorbidity criteria.
4. Univariate & multivariate analysis - FDR-corrected independent testing followed by confounder-adjusted multivariate regression.
5. Variant-interaction analysis - testing combinations of top variants for synergistic or protective effects.
6. Predictive model development - benchmarking eight ML/NN approaches to select the best-performing risk model.
RESULTS AND IMPACT

Pfactorial_Case_Study_Genetic_Risks_Kidney_Cancer image 4
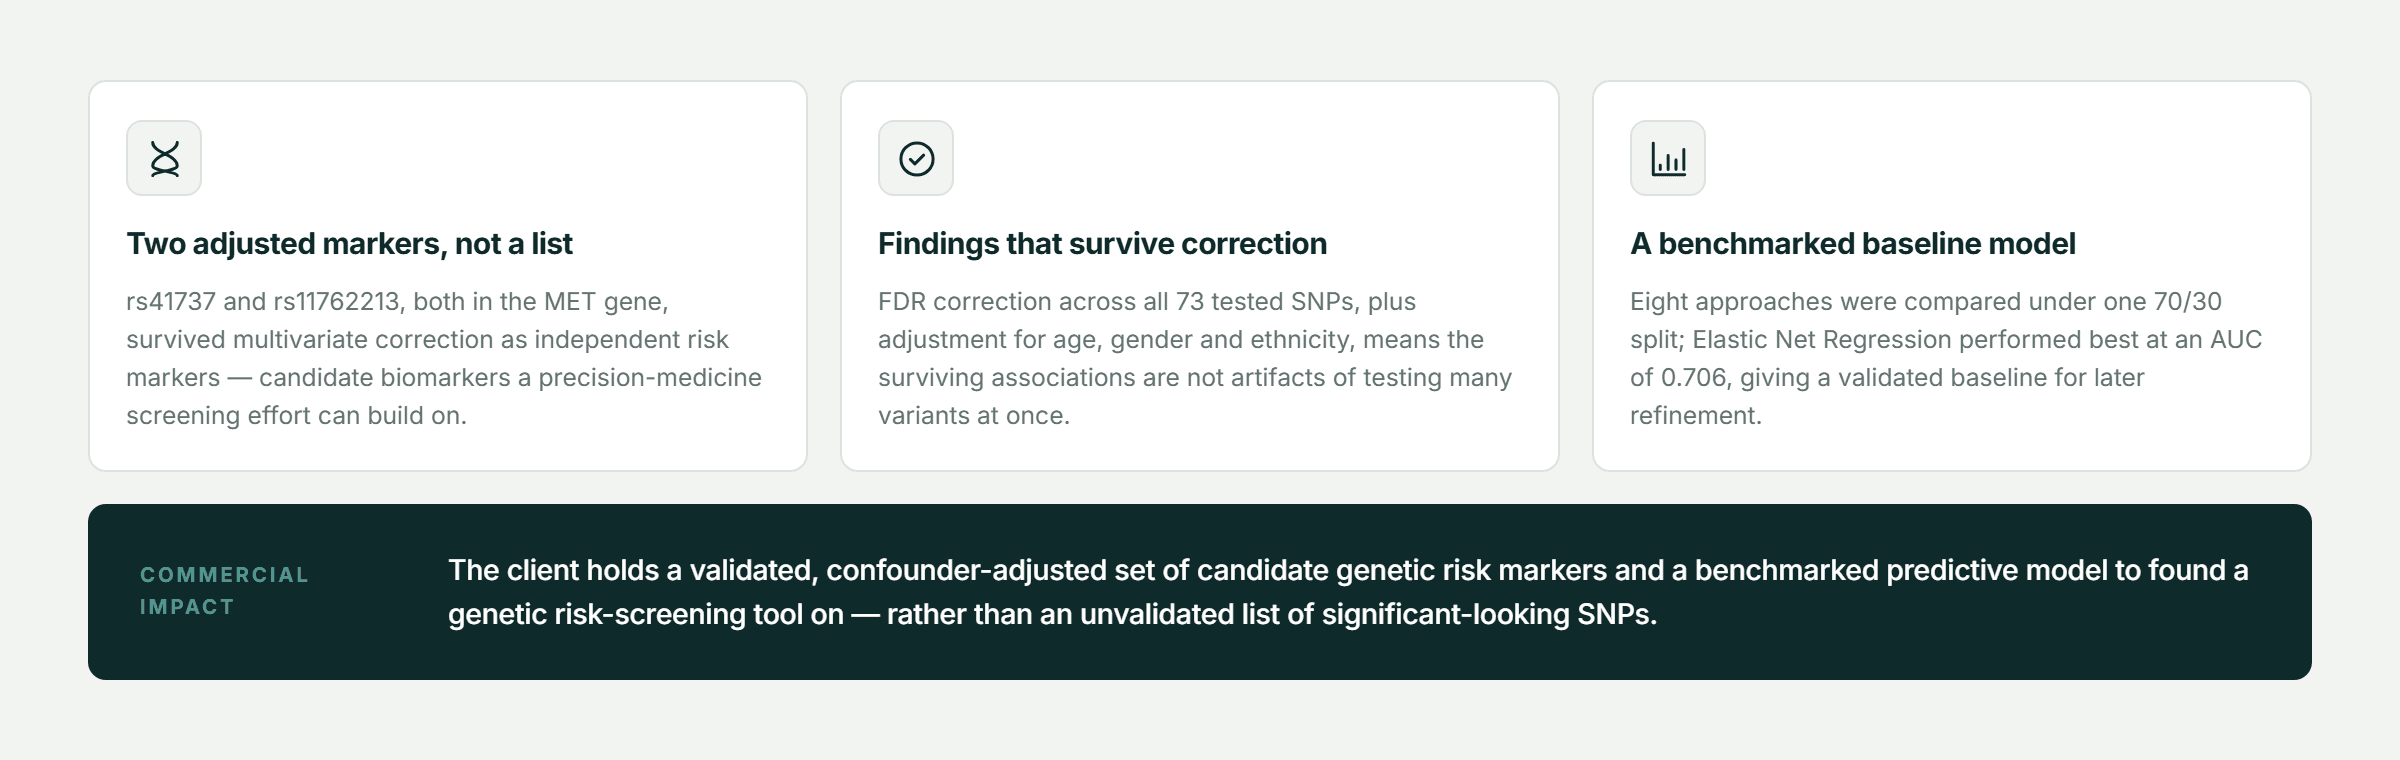
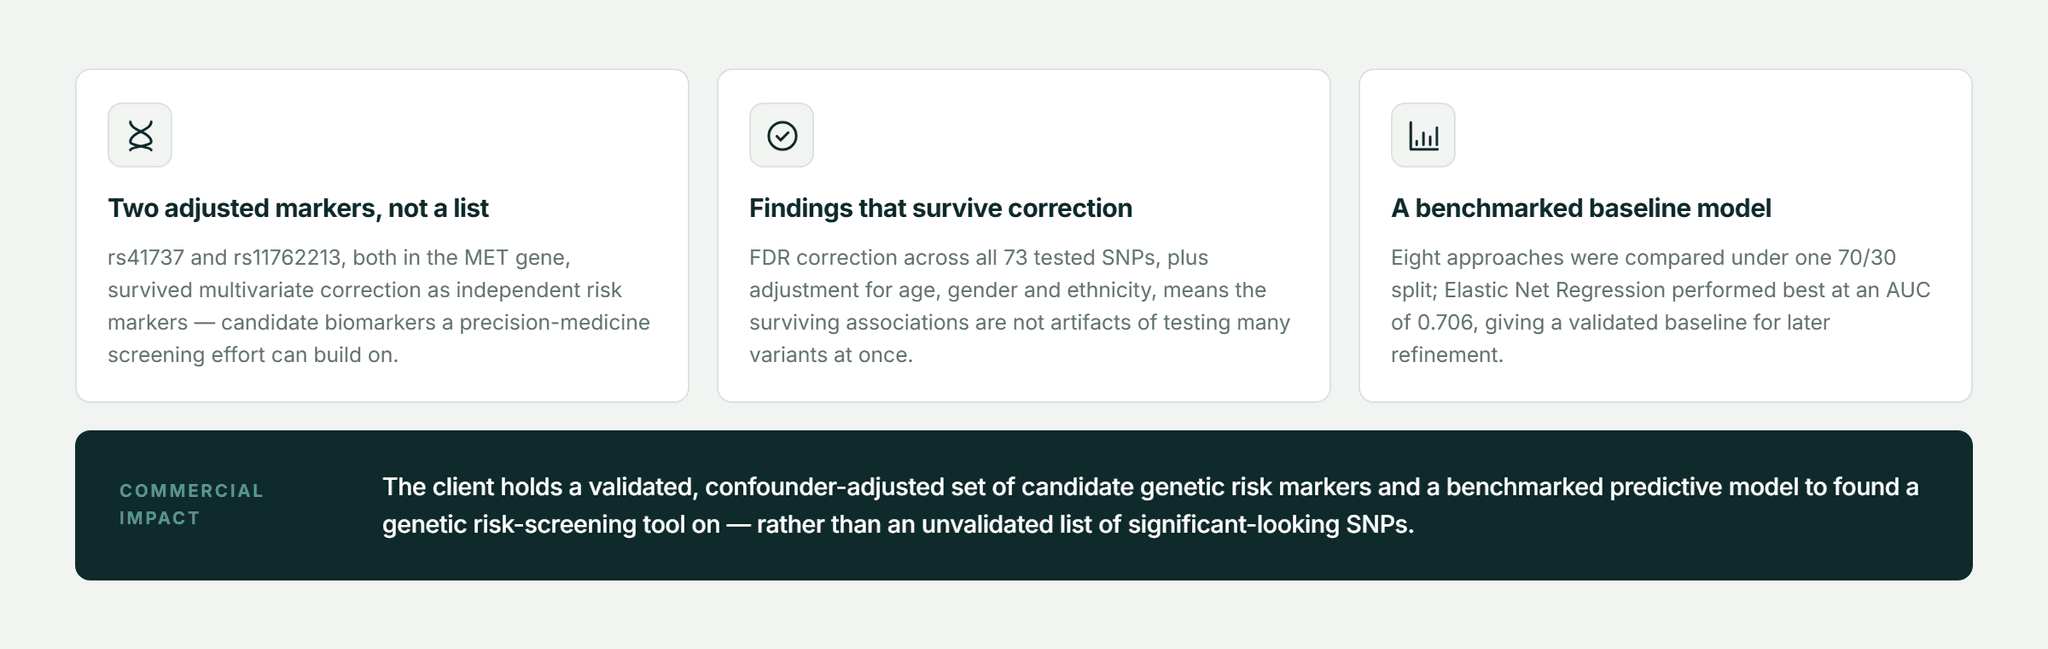
Figure 4 - Key outcomes from this engagement.
Two variants in the MET gene - rs41737 and rs11762213 - emerged as adjusted, independent risk markers for RCC after multivariate correction, providing candidate biomarkers a precision-medicine screening effort could build on.
The best-performing predictive model (Elastic Net Regression) reached an AUC of 0.706, establishing a validated baseline for future model refinement as additional data becomes available.

What it enabled commercially

The client now has a validated, confounder-adjusted set of candidate genetic risk markers and a benchmarked predictive model as a foundation for a genetic risk-screening tool, rather than an unvalidated list of statistically significant-looking SNPs.
WHY PFACTORIAL
This engagement reflects the combination of bioinformatics domain literacy and rigorous applied statistics Pfactorial brings to life-sciences engagements - taking a client from a broad hypothesis to a benchmarked, defensible model.
Pfactorial_Case_Study_Genetic_Risks_Kidney_Cancer image 5
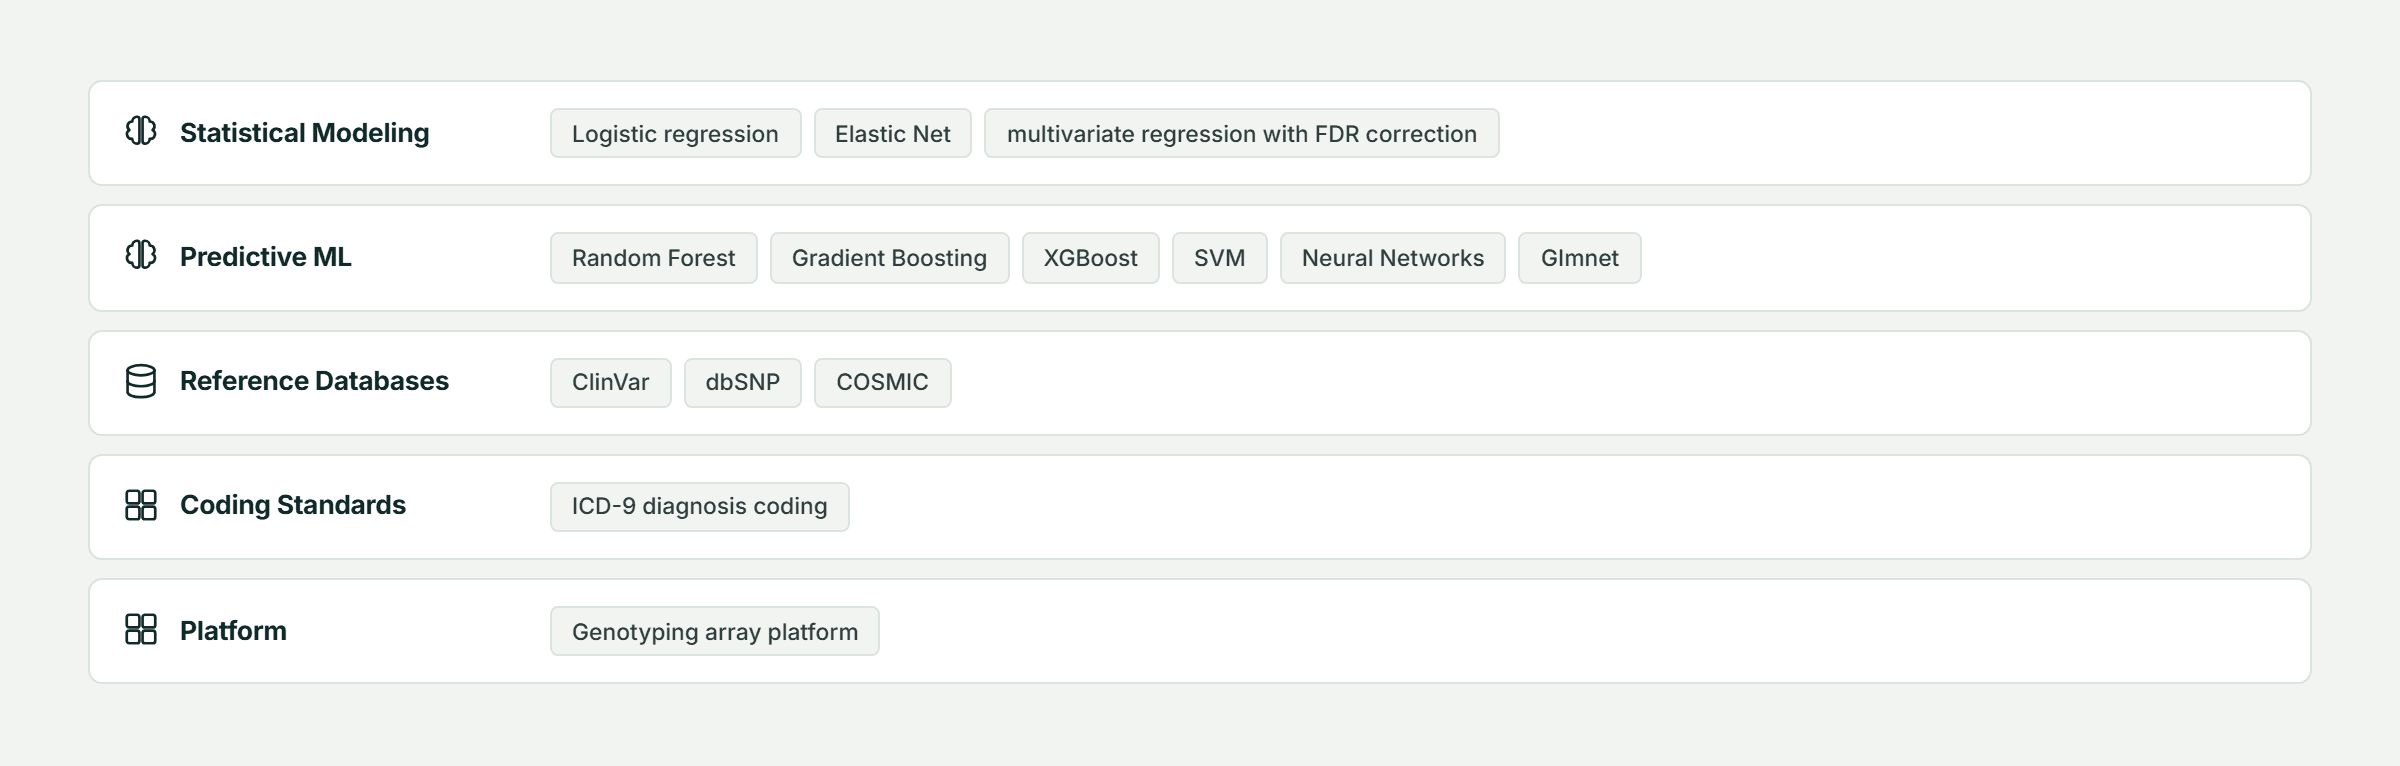
Figure 5 - Service lines this engagement draws on.
Engagement enquiries Pfactorial Technologies works with life-sciences teams that need genomic or clinical data turned into validated, decision-ready models. If you're evaluating a genetic risk-modeling or precision-medicine initiative, we're happy to give you an honest read on scope and risk before anyone commits to anything. · pfactorial.ai
APPENDIX A - TECHNOLOGY STACK
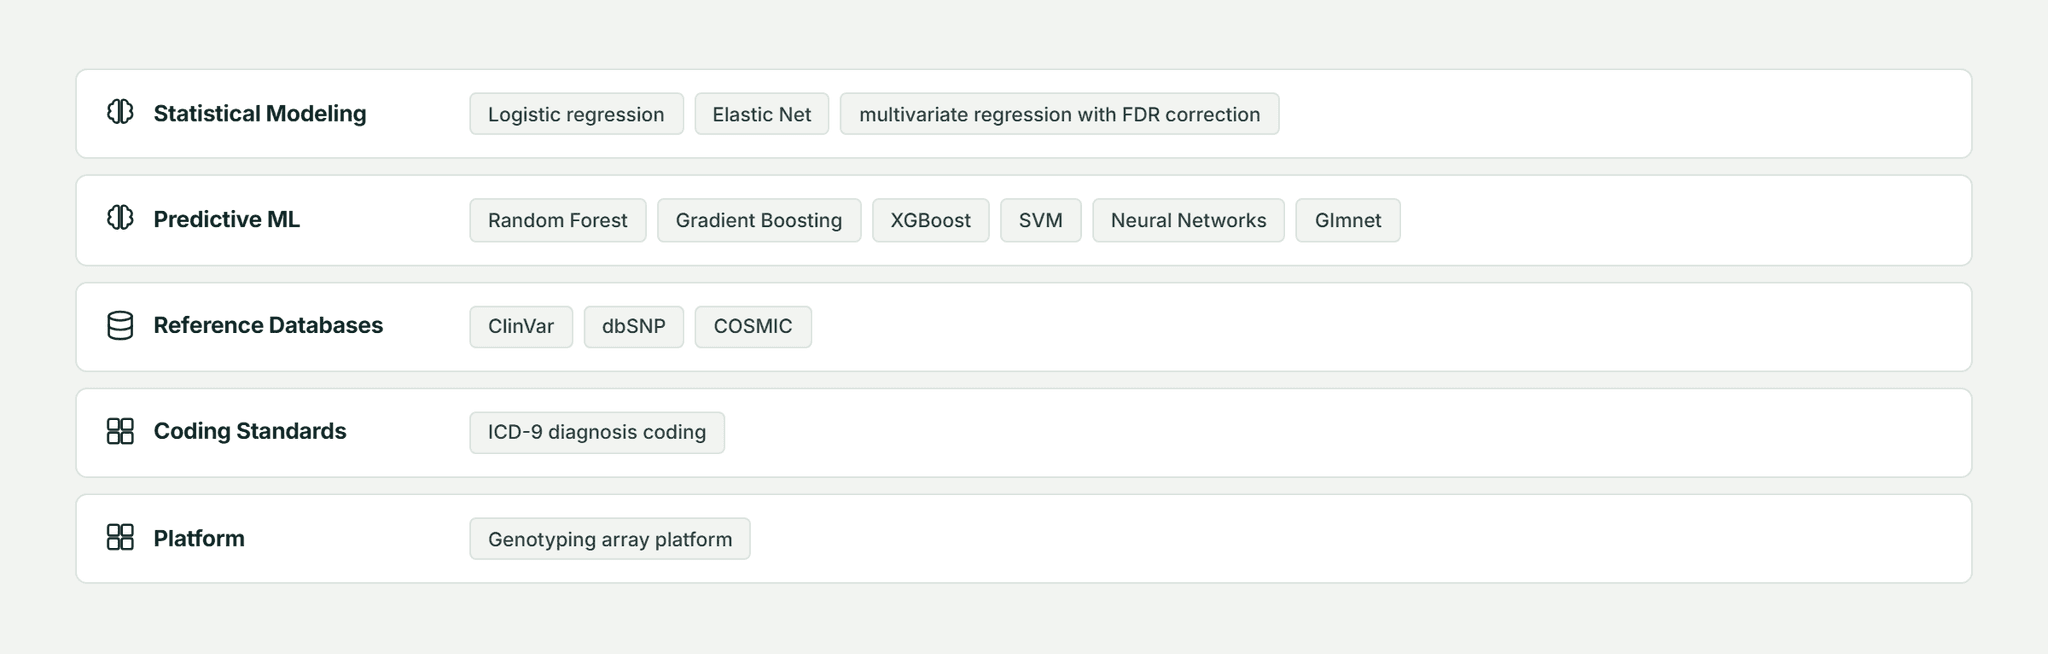
The technology stack underpinning the system, grouped by the layer it serves.
Pfactorial_Case_Study_Genetic_Risks_Kidney_Cancer image 6
© 2026 Pfactorial Technologies. Client identity and product-specific implementation detail are withheld or generalized; no client data, credentials, source code, or infrastructure detail is included in this document.

Result and Analysis

ENGAGEMENT SNAPSHOT

How Pfactorial Technologies built a statistical and machine-learning pipeline that narrowed 603 candidate genetic variants down to validated, adjusted risk markers for kidney cancer.

Pfactorial_Case_Study_Genetic_Risks_Kidney_Cancer image 1
Pfactorial_Case_Study_Genetic_Risks_Kidney_Cancer image 2
Pfactorial_Case_Study_Genetic_Risks_Kidney_Cancer image 3
Pfactorial_Case_Study_Genetic_Risks_Kidney_Cancer image 4
Pfactorial_Case_Study_Genetic_Risks_Kidney_Cancer image 5
Pfactorial_Case_Study_Genetic_Risks_Kidney_Cancer image 6