Back
Healthcare & Clinical

Identifying Disease-Driving Gene Expression Pathways in Pulmonary Arterial Hypertension

How Pfactorial Technologies built an RNA-seq analysis pipeline that pinpoints which genes and biological pathways are dysregulated in PAH patients versus healthy controls.

August 21, 2026
Share
ENGAGEMENT SNAPSHOT

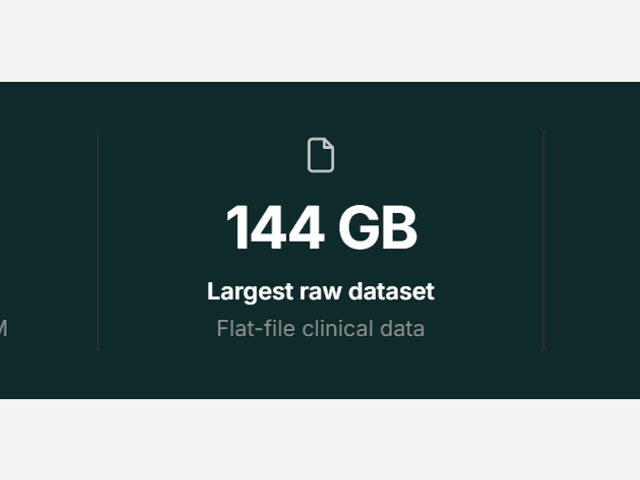
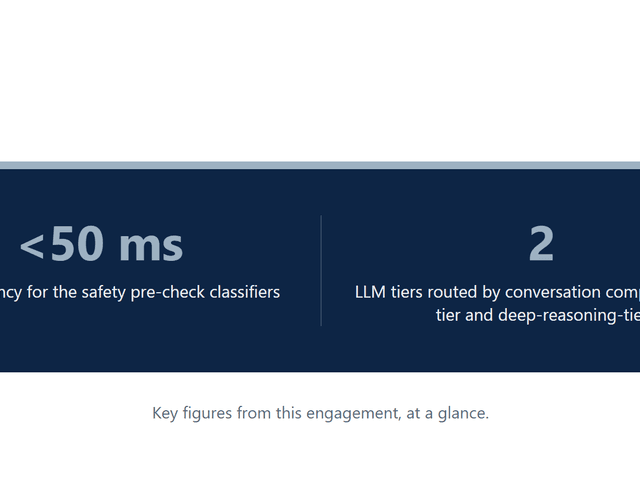
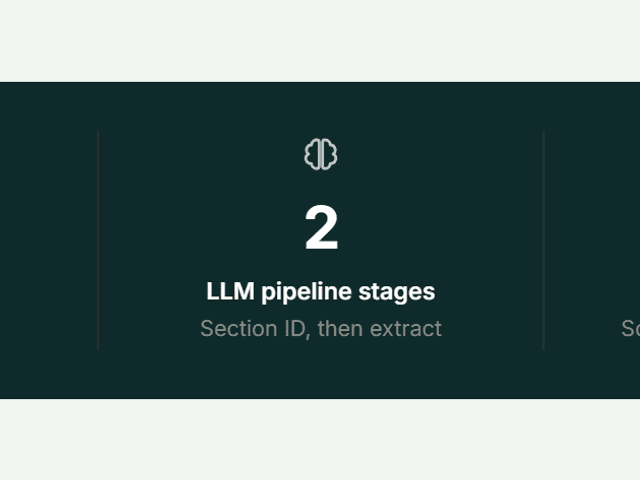
Pfactorial_Case_Study_Gene_Expression_PAH image 1
Figure 1 - Key figures from this engagement, at a glance.
EXECUTIVE SUMMARY
Pulmonary Arterial Hypertension (PAH) is a progressive disease driven by molecular processes that aren't fully understood, and our client wanted to identify which genes and biological pathways actually drive its progression using RNA sequencing data from PAH patients and healthy controls.
Raw RNA-seq data is noisy before it's useful - sequencing depth, GC-content bias and batch effects all distort expression counts unless corrected for - and a list of individually up- or down-regulated genes says little about the biological mechanisms actually at work.
Pfactorial built a pipeline that quantifies, normalizes and validates the RNA-seq data before running differential expression analysis, then connects the resulting gene list to biological pathways through gene set enrichment analysis across four curated reference databases.
Why this engagement is representative This engagement shows Pfactorial's ability to take a raw sequencing dataset all the way to biologically interpretable findings, with the statistical rigor at every stage that a research or therapeutic-development team can actually trust and act on.
THE CHALLENGE
Turning raw sequencing reads into trustworthy biological insight required solving four problems before any conclusion could be drawn.

1. Raw RNA-seq data is noisy before it's useful

Sequencing depth, GC-content bias and batch effects all distort raw expression counts, and any of them left uncorrected can masquerade as a real biological signal.

2. Individual gene changes don't explain disease mechanism

A list of up- and down-regulated genes on its own says little about what biological processes are actually driving PAH - the genes need to be connected to pathways to be actionable.

3. Confounders can masquerade as disease signal

Age and smoking status differ between PAH patients and controls independent of disease biology; without adjustment, those differences could be mistaken for PAH-driven expression changes.

4. Subtle expression changes still matter biologically

A significance threshold that only catches large fold-changes would miss modest but biologically important shifts in expression - the analysis needed to stay sensitive to those.
The real brief Not “run a differential expression tool” but “build a pipeline that goes from raw sequencing reads to biologically interpretable pathways, with statistical rigor trustworthy at every step.”
THE SOLUTION
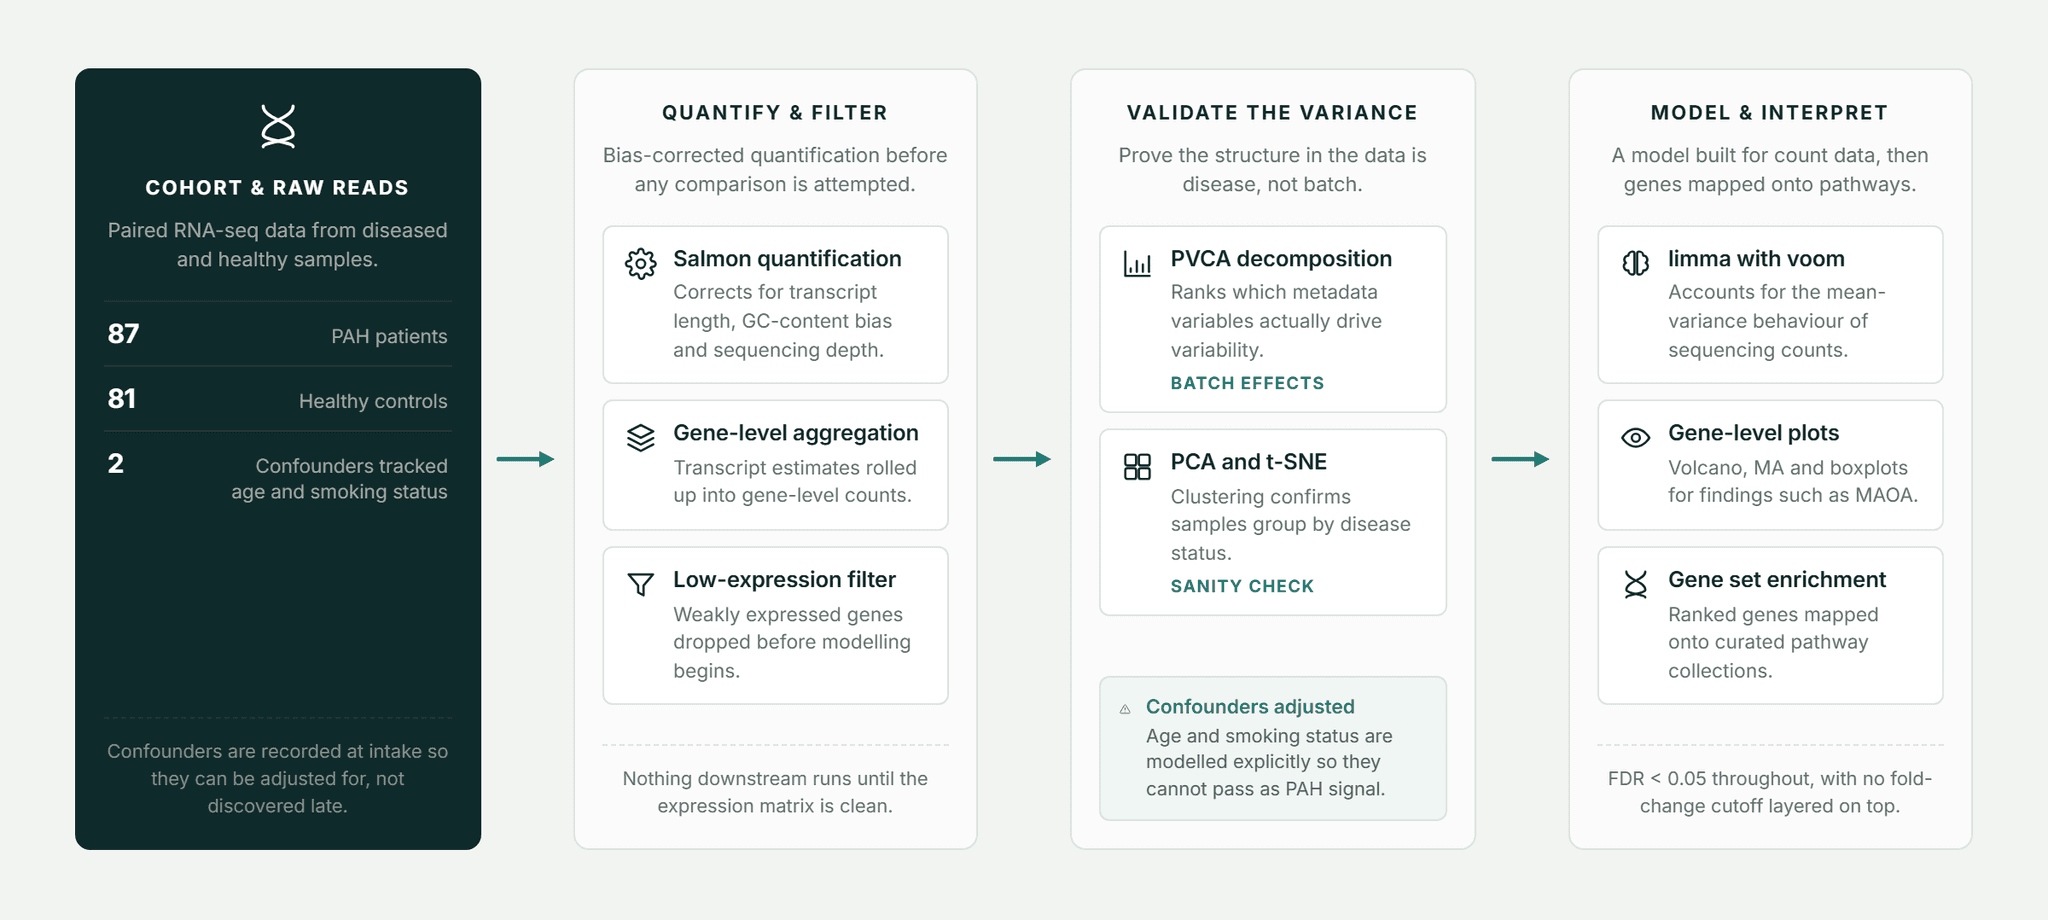
Pfactorial built the pipeline around QC and normalization first, a statistical model suited to RNA-seq's specific noise characteristics, and pathway-level enrichment analysis to connect individual genes to disease mechanism.
Pfactorial_Case_Study_Gene_Expression_PAH image 2
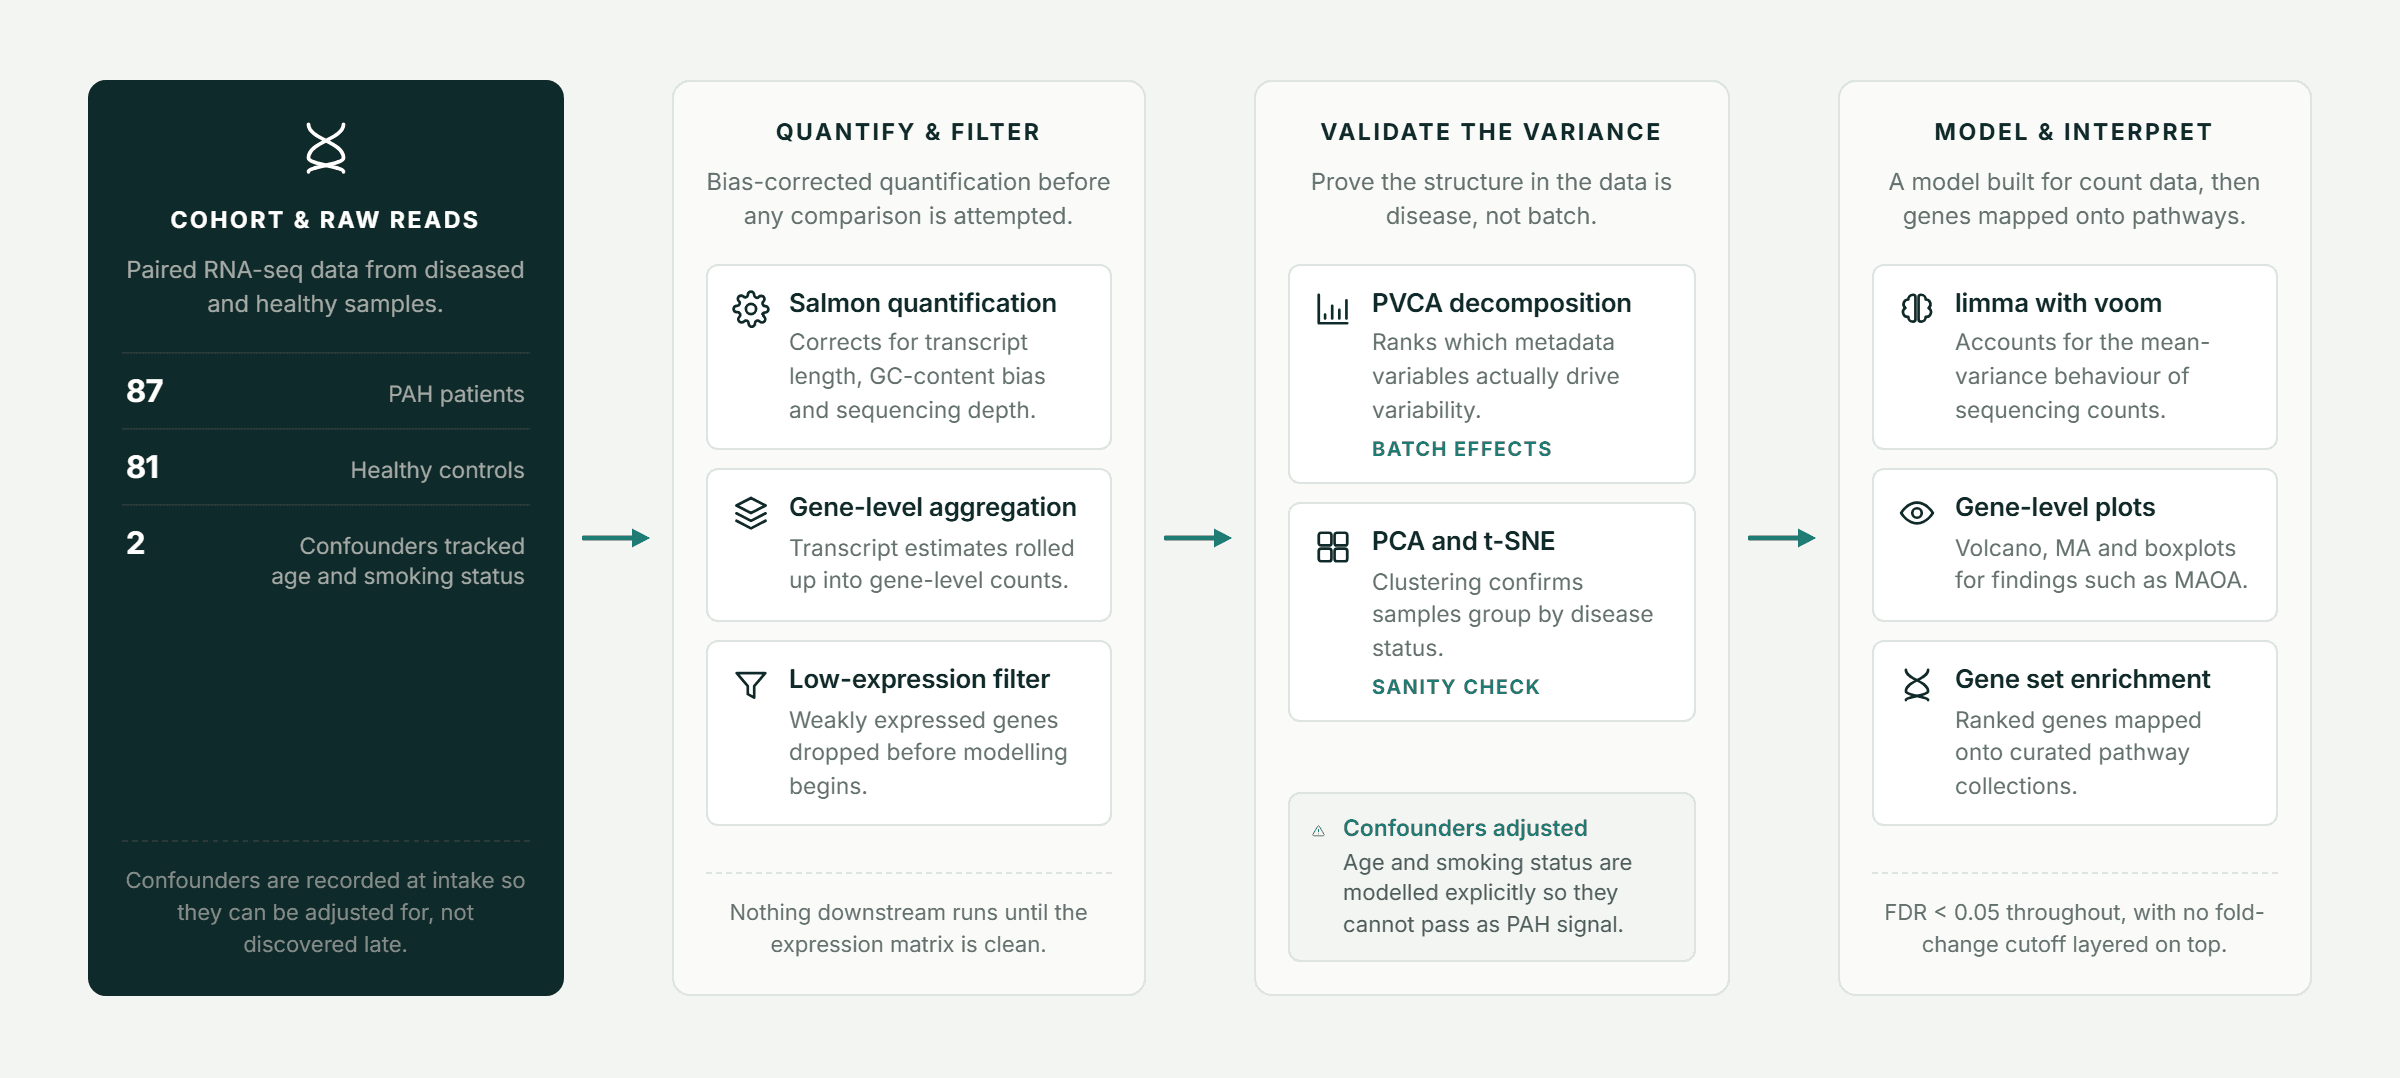
Figure 2 - From raw sequencing reads to validated pathway-level findings.

Architectural principles

  • QC and normalization before anything else - Transcript-level quantification (via Salmon), gene-level aggregation, and low-expression filtering all happen before differential expression is attempted, so downstream results rest on a clean foundation.
  • Variance decomposition catches batch effects early - Principal Variance Component Analysis identifies which technical or biological factors actually drive variability in the dataset, before that variability is mistaken for disease signal.
  • A statistical model built for RNA-seq's quirks - limma with voom transformation, rather than a generic linear model, accounts for the mean-variance relationship specific to sequencing count data.
  • From genes to pathways - Gene set enrichment analysis connects individual differentially expressed genes to the biological pathways they collectively point to, using curated reference sets spanning core processes, established pathway databases, regulatory motifs and functional classifications.
CAPABILITIES DELIVERED
Each deliverable builds on a validated prior stage, from raw counts to ranked biological pathways.
CAPABILITY
WHAT IT DOES
QC'd expression matrix
Normalized RNA-seq data for 87 PAH patients and 81 healthy controls.
Differential expression analysis
FDR-corrected significance testing via limma with voom transformation.
Clustering diagnostics
PCA and t-SNE validation confirming sample grouping reflects disease, not technical artifact.
Gene set enrichment analysis
Pathway enrichment across four curated reference gene-set databases.
Gene-level visualization
Volcano, MA and boxplot visualizations for key findings such as MAOA.
Documented statistical thresholds
FDR < 0.05 with no arbitrary fold-change cutoff, applied consistently throughout.
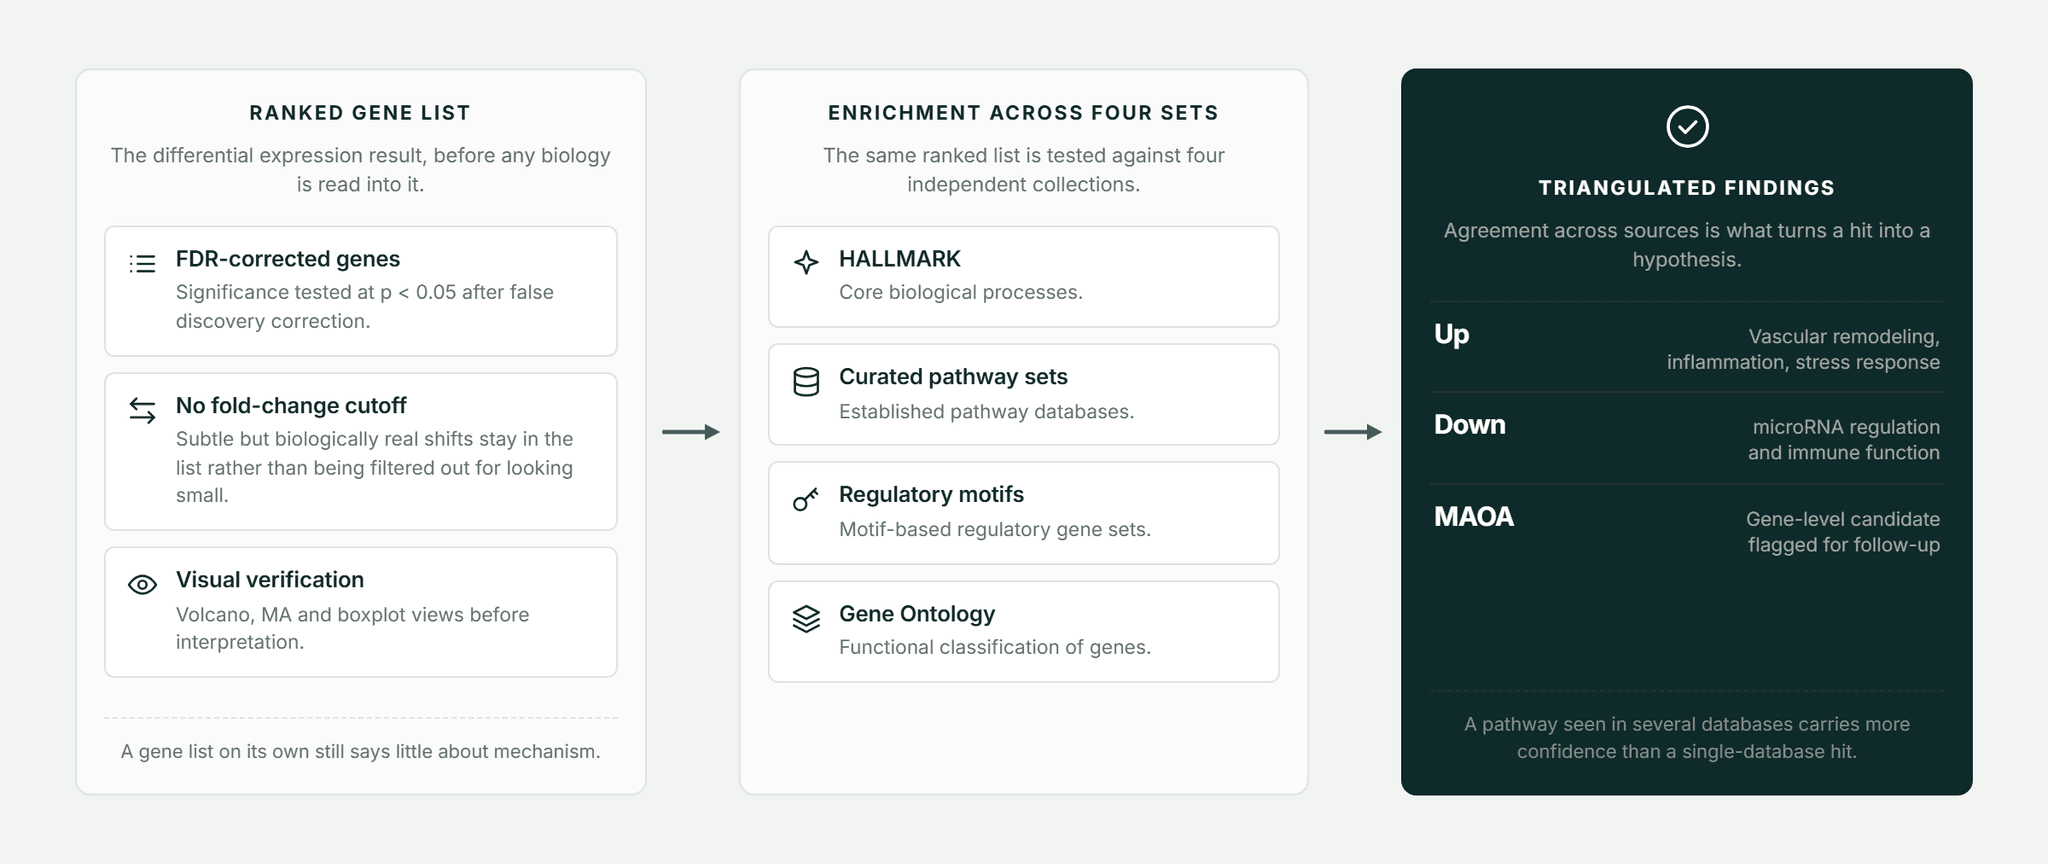
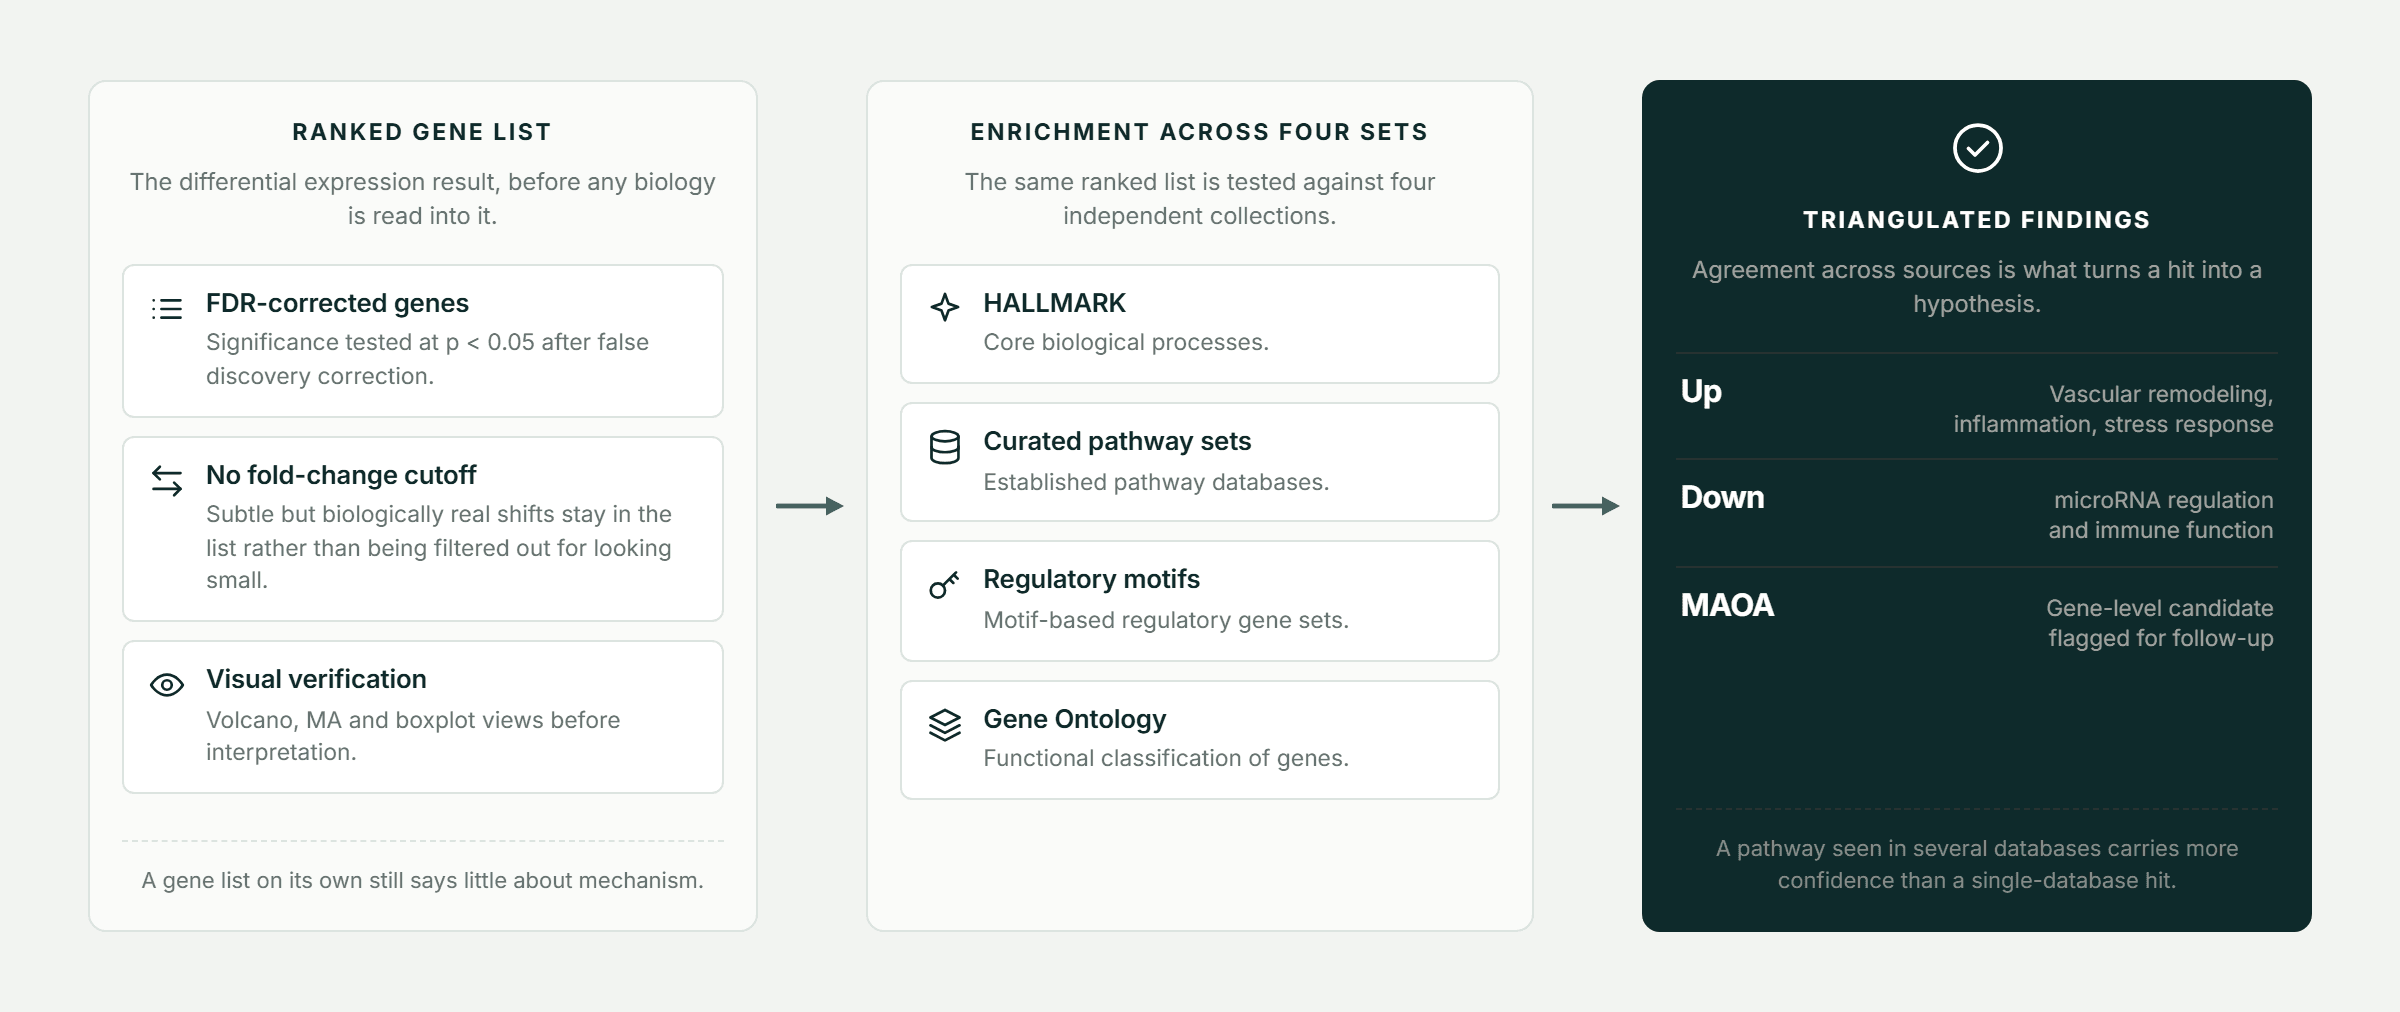
Pfactorial_Case_Study_Gene_Expression_PAH image 3
Figure 3 - Four curated databases triangulate which pathway findings are robust.
Design note No fold-change cutoff was applied on top of the FDR threshold - a deliberate choice to keep subtle but biologically important expression changes visible, rather than filtering them out for looking small.
ENGINEERING FOR SCALE AND RELIABILITY
Six methodological decisions keep the pipeline's findings defensible from raw reads through to pathway-level conclusions.

Bias-corrected transcript quantification

Salmon-based quantification accounts for transcript length, GC-content bias and sequencing depth variation, improving the reliability of expression estimates before any downstream analysis.

Variance decomposition before conclusions

PVCA-driven analysis identifies which metadata variables contribute most to variance in the dataset, separating technical batch effects from true biological variability.

Clustering diagnostics as a sanity check

PCA and t-SNE clustering were run before differential analysis to confirm sample groupings reflected disease status rather than a technical artifact.

RNA-seq-appropriate statistical modeling

limma with voom transformation was used specifically because it accounts for how RNA-seq data's variability changes with expression level, unlike a generic linear model.

Consistent FDR-adjusted thresholds

A p<0.05 FDR-adjusted significance threshold was applied consistently across all differential expression results, avoiding threshold-shopping.

Multi-database pathway triangulation

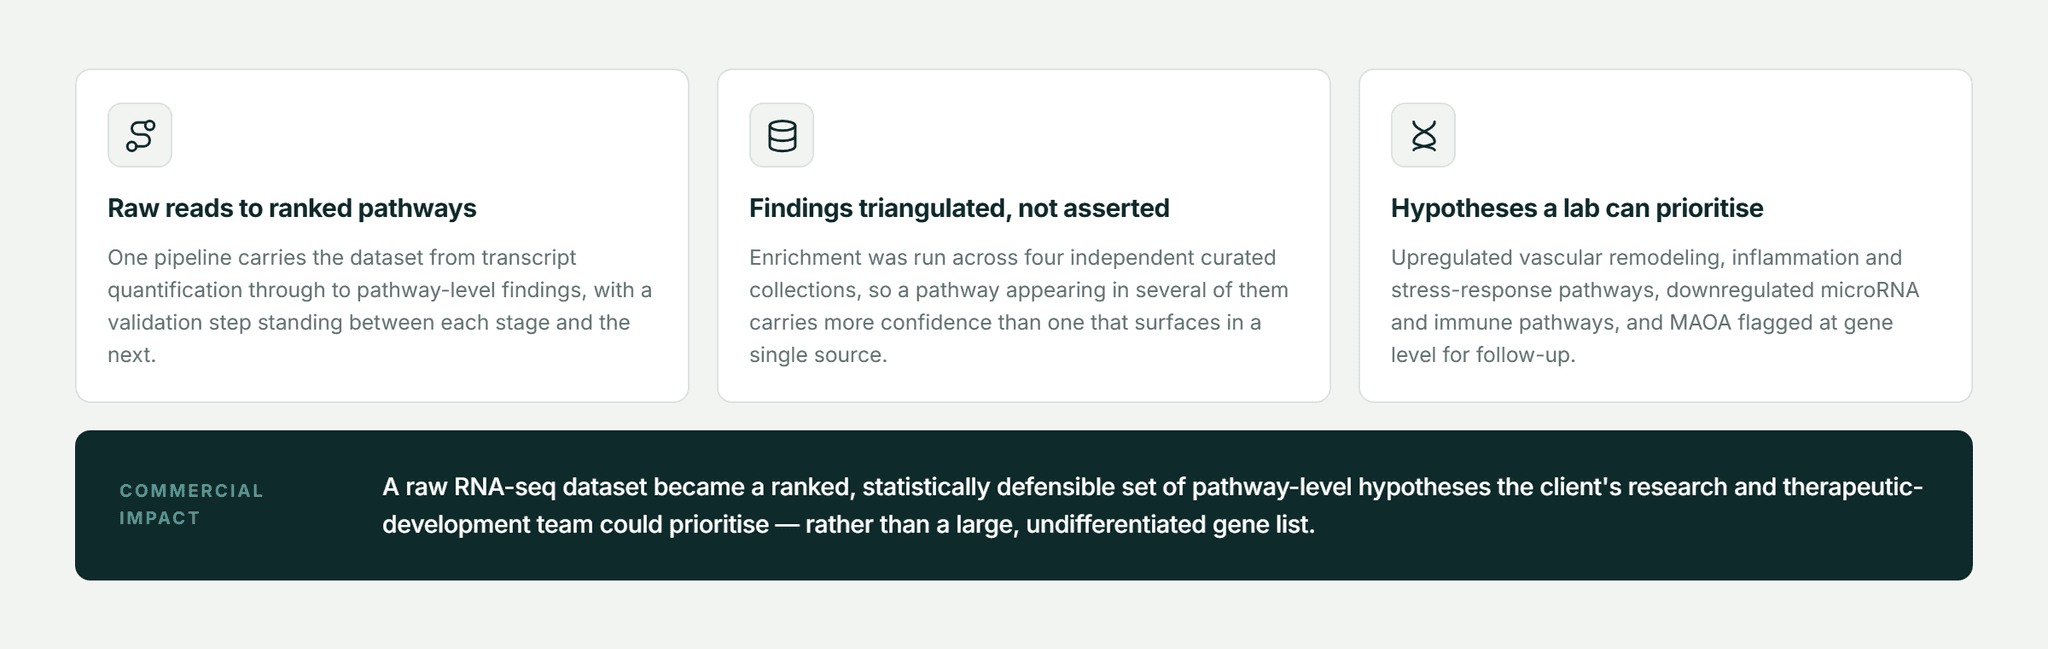
Gene set enrichment was run across four independent curated databases, so pathway findings that appear across multiple sources carry more confidence than a single-database hit.
DELIVERY APPROACH
The engagement moved from raw sequencing data to biological interpretation in clearly validated stages.
1. RNA-seq preprocessing & QC - transcript quantification via Salmon and gene-level aggregation of expression data.
2. Normalization & batch-effect assessment - PVCA-based variance decomposition and PCA/t-SNE clustering diagnostics.
3. Differential expression modeling - limma with voom transformation to identify significantly differentially expressed genes.
4. Gene-level visualization & validation - volcano, MA and boxplot visualizations to interpret and communicate key findings.
5. Gene set enrichment analysis - pathway enrichment across HALLMARK, curated, regulatory and Gene Ontology gene sets.
6. Biological interpretation & reporting - synthesis of upregulated and downregulated pathway findings into actionable research hypotheses.
RESULTS AND IMPACT

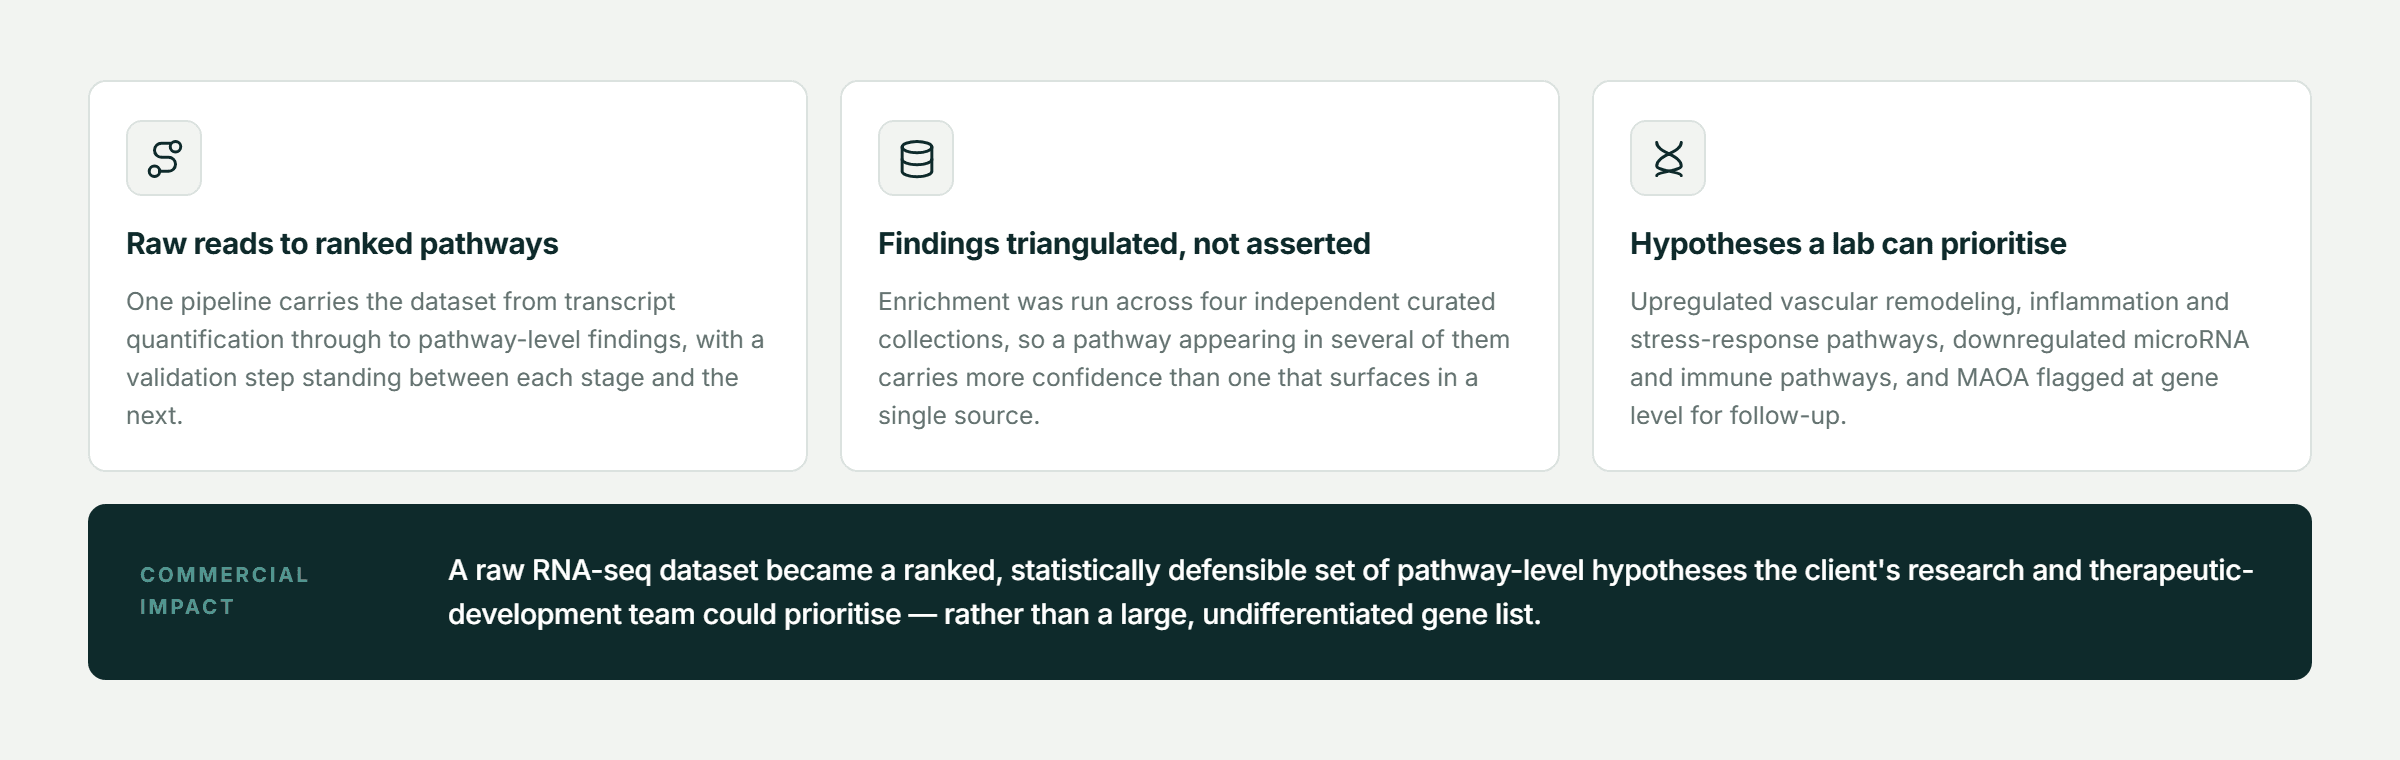
Pfactorial_Case_Study_Gene_Expression_PAH image 4
Figure 4 - Key outcomes from this engagement.
Upregulated pathways tied to vascular remodeling, inflammation and stress response, and downregulated pathways tied to microRNA regulation and immune function, gave the client's research team a prioritized set of pathway-level hypotheses for follow-up validation.
Gene-specific findings, including differential expression of MAOA, were flagged as candidates worth further investigation given their established links to vascular function and oxidative stress.

What it enabled commercially

The engagement turned a raw RNA-seq dataset into a ranked, statistically defensible set of pathway-level hypotheses the client's research or therapeutic-development team can prioritize for follow-up, rather than a large undifferentiated gene list.
WHY PFACTORIAL
This engagement reflects Pfactorial's bioinformatics service line: rigorous, reproducible analysis pipelines that turn raw genomic data into pathway-level findings a research team can act on with confidence.
Pfactorial_Case_Study_Gene_Expression_PAH image 5
Figure 5 - Service lines this engagement draws on.
Engagement enquiries Pfactorial Technologies works with life-sciences teams that need raw sequencing data turned into validated, interpretable biological findings. If you're evaluating an RNA-seq or gene-expression analysis initiative, we're happy to give you an honest read on scope and risk before anyone commits to anything. · pfactorial.ai

APPENDIX A - TECHNOLOGY STACK
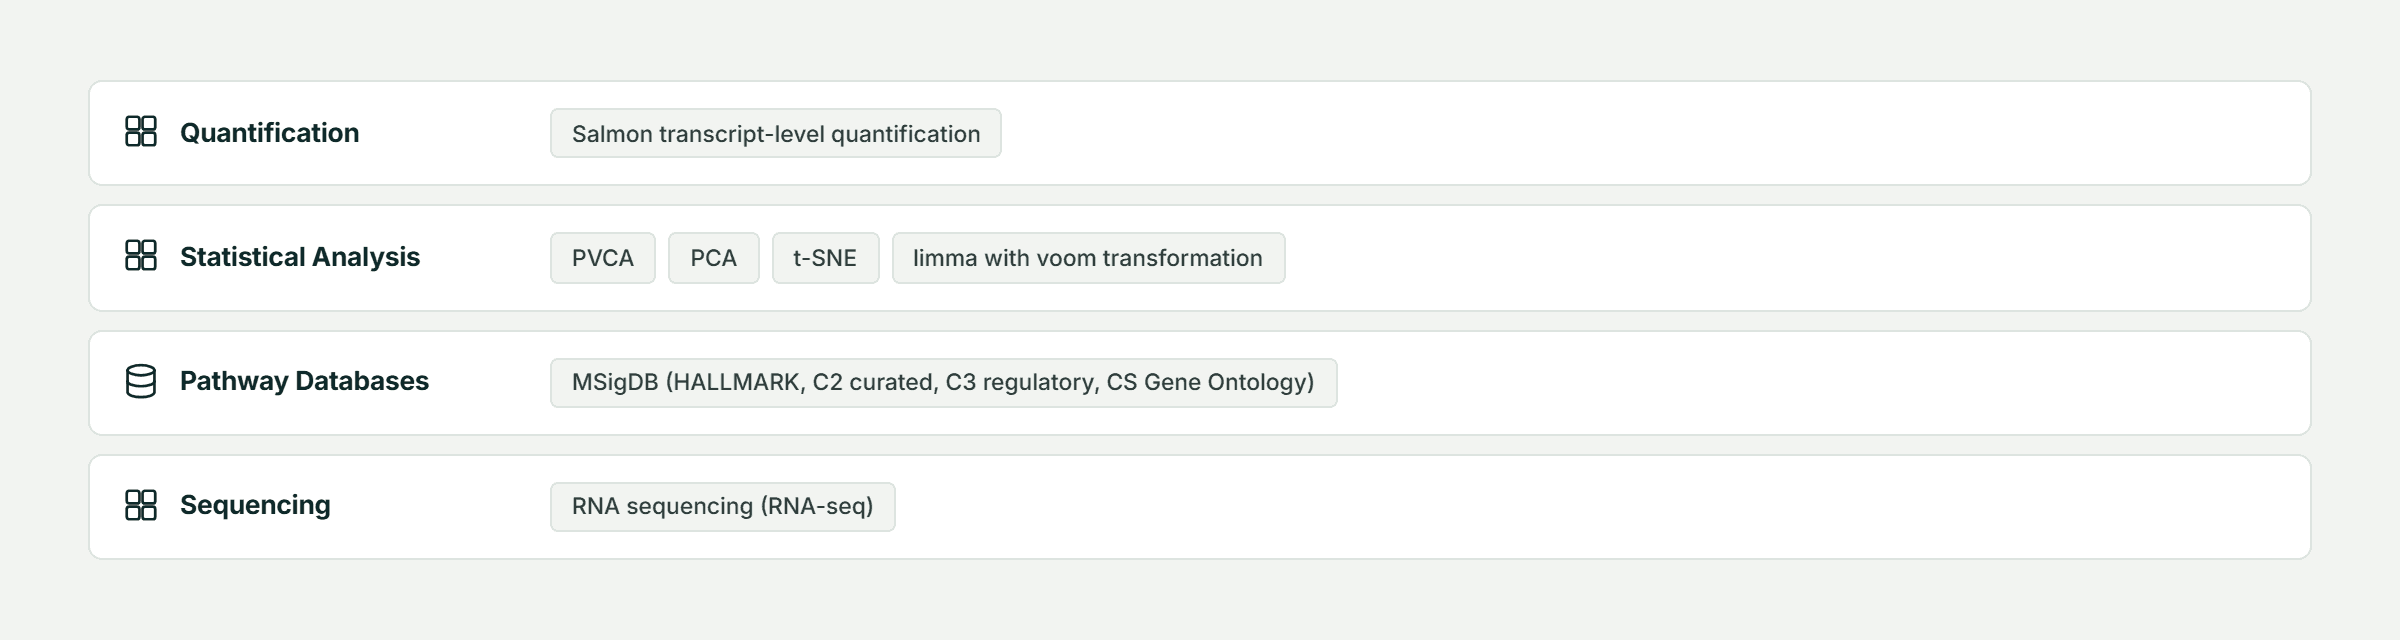
The technology stack underpinning the system, grouped by the layer it serves.
Pfactorial_Case_Study_Gene_Expression_PAH image 6
© 2026 Pfactorial Technologies. Client identity and product-specific implementation detail are withheld or generalized; no client data, credentials, source code, or infrastructure detail is included in this document.

Result and Analysis

ENGAGEMENT SNAPSHOT

How Pfactorial Technologies built an RNA-seq analysis pipeline that pinpoints which genes and biological pathways are dysregulated in PAH patients versus healthy controls.

Pfactorial_Case_Study_Gene_Expression_PAH image 1
Pfactorial_Case_Study_Gene_Expression_PAH image 2
Pfactorial_Case_Study_Gene_Expression_PAH image 3
Pfactorial_Case_Study_Gene_Expression_PAH image 4
Pfactorial_Case_Study_Gene_Expression_PAH image 5
Pfactorial_Case_Study_Gene_Expression_PAH image 6