Back
Analytics & BI Dashboards

Beginner's Guide to A/B Testing & Hypothesis Testing

Author
Pfactorial
June 27, 2024
Share
AB testing
You want to score maximum marks in an exam. You heard from your relative that playing calm music during studying can help learning fast. You shared this secret to some of the students in the class , and they also tried this strategy. The students who listened to calm music during studying achieved higher marks compared to those who didn’t listen to calm music. You are now happy ,right?  You are proud of yourself for helping other students to achieve good marks. But wait ! Is the results of students who used the calm music strategy a result of pure chance , or did the strategy actually work?

How do we decide what worked ? pure chance or the strategy.

What if i tell you there is a solution for this problem.
 Yes ,don’t be worried ,our solution is HYPOTHESIS TESTING.
Let’s understand what hypothesis testing is in the next section.
What is hypothesis testing?
Let’s understand hypothesis testing based on our current problem.You need to find whether the marks you and your friends scored is a result of pure chance or did the strategy actually work.

There are two possibilities:
A : There is no relationship between listening to calm music during studying and scoring good marks (null hypothesis).
B : There is a relationship between listening to calm music during studying and scoring good marks (alternative hypothesis).

By now you might have an intuition regarding where the term ‘A/B testing’ comes from. You are testing two possibilities A and B.

A  is also known as the null hypothesis which states that the calm music strategy has no effect on the marks and it doesn’t matter whether you listen to calm music or not.
B  is also known as the alternative hypothesis which states that the calm music strategy has an effect on the marks.

Now we have a null hypothesis and an alternative hypothesis.It’s time to decide whether we want to reject the null hypothesis or accept it .
This decision making process is called Hypothesis testing. 
 Let’s understand how to decide whether we want to reject the null hypothesis or accept the null hypothesis in the next section.
How hypothesis testing works?
To make a decision between rejecting the null hypothesis and accepting the null hypothesis, we need to check the probability of ‘calm music strategy’ actually working when the null hypothesis is True. It's a little hard to understand right ?Let me simplify it for you.

We simply want to measure the probability of ‘calm music strategy’ working (alternative hypothesis) given that we accept ‘calm music strategy’ is not working(null hypothesis).If the probability of ‘calm music strategy’ working even after we accept the null hypothesis is really low ,we can then reject the null hypothesis. This  means marks of students who listened to calm music is a rare event and not a result of pure chance.

But what is the probability threshold. The standard value is 0.05 (5 percent probability) which is known as P value. This means that if the probability of ‘calm music strategy’ working under the condition that the null hypothesis is accepted is below 5 percent ,we reject the null hypothesis.

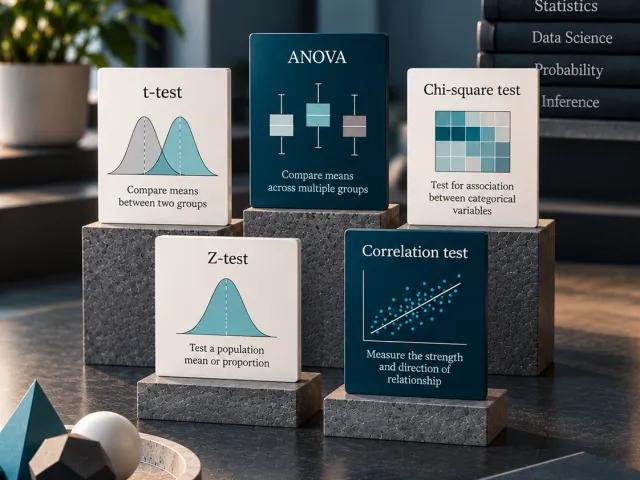
For finding the p value there are different statistical tests like, t test, z test, anova test etc:

For our problem we can use a one way anova test, which is a type of anova test that checks whether the means of two or more groups are significantly different. Here our two groups are marks of students who used the ‘calm music’ strategy and the marks of those students who did not use the ‘calm music’ strategy.If there is a significant difference between the means of two groups we can say that the variable influences the dependent variable. In our case it is marks.

If the p value that we get from the one way anova test is less than 0.05 we reject the null hypothesis and if it is greater than 0.05 we accept the alternative hypothesis
Implementing hypothesis testing
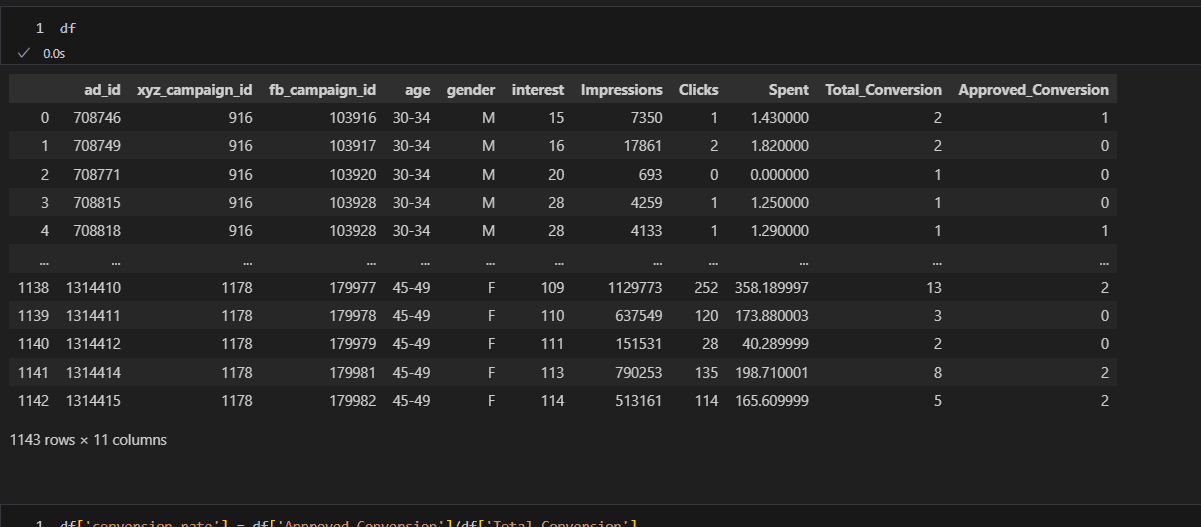
We are going to implement hypothesis testing using a sales conversion dataset that contains data about sales conversions based on facebook ad campaigns.
Dataset
Dataset format :
Data AB

Columns  :
1.) ad_id: an unique ID for each ad.
 2.) xyz_campaign_id: an ID associated with each ad campaign of XYZ company.
3.) fb_campaign_id: an ID associated with how Facebook tracks each campaign.
4.) age: age of the person to whom the ad is shown.
 5.) gender: gender of the person to whom the add is shown
6.) interest: a code specifying the category to which the person’s interest belongs (interests are as mentioned in the person’s Facebook public profile). 7.) Impressions: the number of times the ad was shown.
8.) Clicks: number of clicks on for that ad.
9.) Spent: Amount paid by company xyz to Facebook, to show that ad.
10.) Total conversion: Total number of people who enquired about the product after seeing the ad.
11.) Approved conversion: Total number of people who bought the product after seeing the ad.
Data aggregation
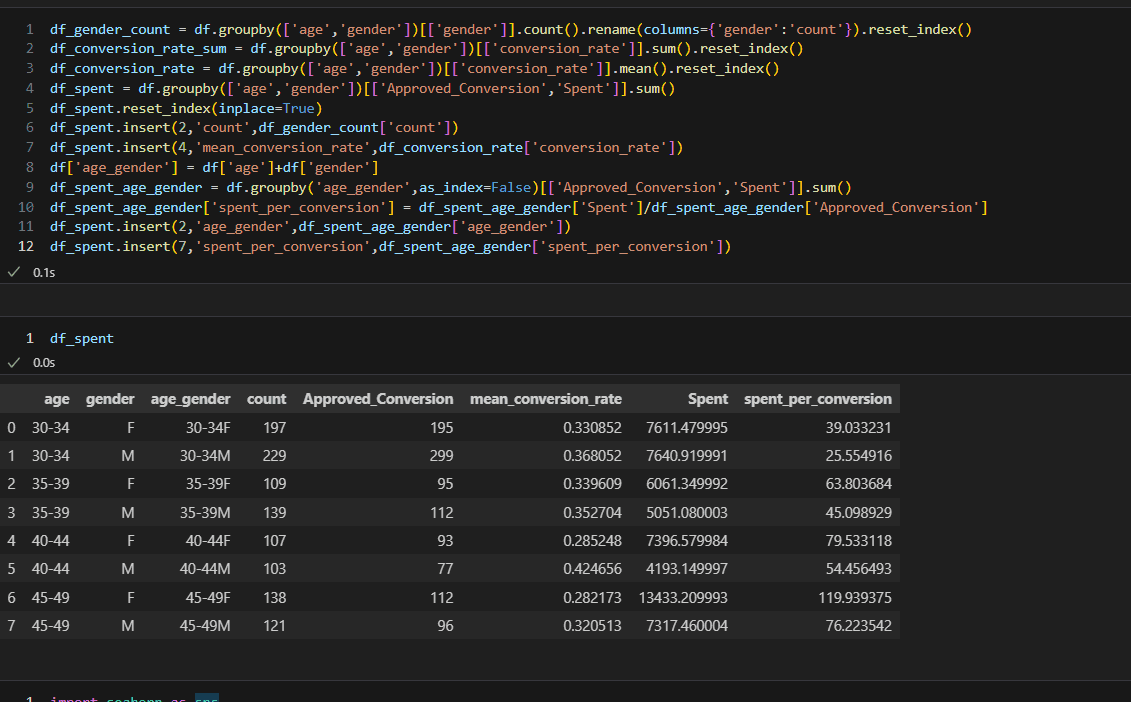
To understand the summary of our dataset we can aggregate our data and visualise it. Here we create the age_gender column by combining the age and gender and mean conversion date is calculated for each age gender combination. spent per conversion calculates the amount spent in the ad campaign for each age_gender combination.
Data aggregation AB testing
Visualisation
Here we are visualising spent, Approved conversion, count and mean conversion rate based on age category ad gender.
Aggregate data visualization AB testing
Inference
After visualising the data we can see the following trends:
  • For all age ranges except 30-34 the total amount spent on ads displayed to Female is more than male
  • For  age ranges 30-34 and 35-39  ads displayed to males have more approved conversions and females for the other two ranges
  • For age ranges 30-34 and 35-39 ads displayed  males have the high count and females for the remaining two ranges
  • For all age ranges ads displayed to males have more conversion rate

We can also perform a combined analysis using all  the variables we used in the visualisation like this.

Combined analysis AB testing
Questions
We have some inference from the visualisation.Now it’s time to frame the questions based on which we want to perform the hypothesis testing .


● Is there a relationship between age and conversion?
● Is there a relationship between gender and conversion?
● Is there a relationship between amount spent and conversion?

Hypothesis testing
First let’s check if there is a relationship between age and conversion.
We are using a one way anova test to find the p value .
Before finding the p value we need to frame our null hypothesis and alternate hypothesis.
Null hypothesis - There is no significant difference between the means of the  Approved conversion for  male and female .Hence gender is not affecting the approved conversion .
Alternate hypothesis - There is a significant difference between the means of the Approved conversion for male and female  .Hence gender affects the conversion rate.
We will use f_oneway function from scipy library to perform our hypothesis testing
from scipy.stats import f_oneway
First we separate the conversions for Male and Female and pass these two groups to the f_oneway function to find the p value.
For the three categorical variables gender,age category, age category gender combination . We found that age category and age category gender combination can influence the conversions.

For continuous variables 'Spent','Impressions','Clicks','Approved_Conversion','Total_Conversion',
First we find the pearson correlation between the variables with Approved conversions.

Pearson correlation simply calculates the strength of the linear relationship between two variables,ie,if one variable decreases or increases with a change in another variable.From the pearson correlation p value can be calculated using pearsonr function from scipy.

from scipy.stats import pearsonr

In Fact all the steps from finding the pearson correlation to calculating the p value is done by the pearsonr function.
We are performing hypothesis testing for continuous variables Impressions, clicks and spent.

For all continuous variables for which we performed hypothesis testing, the null hypothesis is rejected.

Finding the variables that influence conversion the most.
We have successfully calculated p values for 3 categorical and 3 continuous variables and found that for all variables except gender, null hypothesis got rejected.

Now it’s time to find variables that have a high influence on conversion. For that we simply need to calculate the variable with least p value for each category(categorical and continuous variables)
Here we can see that impressions have the minimum p value among the continuous variables and the age category has the minimum p value among categorical variables.(Note : Not the age category gender combination).
Conclusion
From the hypothesis testing we can conclude that age category and Impressions are the most important variables that have more influence on the conversions.Thus these two variables are important for conversions and can be used to create machine learning models to predict the conversions.
We have successfully completed hypothesis testing .Hypothesis testing is not limited to the methods that we used in this blog .There are many other techniques that are used in hypothesis testing depending on the problems we want to solve.I hope you learned something new from our blog.Happy learning
DISCOVER MORE. CONNECT WITH US!

Intrigued by what you have read? Dive deeper and stay ahead with the latest insights and trends. We are here to answer your questions and help you explore further.