Back
June 26, 2024
Analytics & BI Dashboards
Basic Types of Statistical Tests in Data Science
Pfactorial
Share

Statistical tests are at the heart of data science, and they play a crucial role in helping us to make informed decisions about our data. They allow us to test our hypotheses, to assess the strength of evidence, and to make reliable inferences about the world around us.
Terminologies
Before going into the types of statistical tests and their implementation, it is necessary to understand the meanings of some terminologies.
Hypothesis Testing
Hypothesis Testing in statistics is a method to test the results of experiments or surveys to see if you have meaningful results. It is useful when you want to infer a population based on a sample or correlation between two or more samples.

Null Hypothesis
This hypothesis states that there is no significant difference between sample and population or among different populations. It is denoted by H0.
Alternate Hypothesis
The statement contrary to the null hypothesis comes under the alternate hypothesis. It is denoted by H1.
Type 1 error:
A type 1 error, often referred to as a false positive, happens when a researcher rejects a real null hypothesis incorrectly. This suggests you’re claiming your findings are noteworthy after they actually happened by coincidence.
Type 2 error:
A type II error commonly said as a false negative happens when a researcher fails to reject a null hypothesis that’s actually true. During this case, a researcher finds that there’s no significant influence when, in fact, there is.

Critical Value
It is a point on the scale of the test statistic beyond which the null hypothesis is rejected. Higher the critical value, lower the probability of 2 samples belonging to the same distribution. The critical value for any test can
p-value
p-value stands for ‘probability value’; it tells how likely it is that a result occurred by chance alone. Basically, the p-value is used in hypothesis testing to help you support or reject the null hypothesis. The smaller the p-value, the stronger the evidence to reject the null hypothesis.
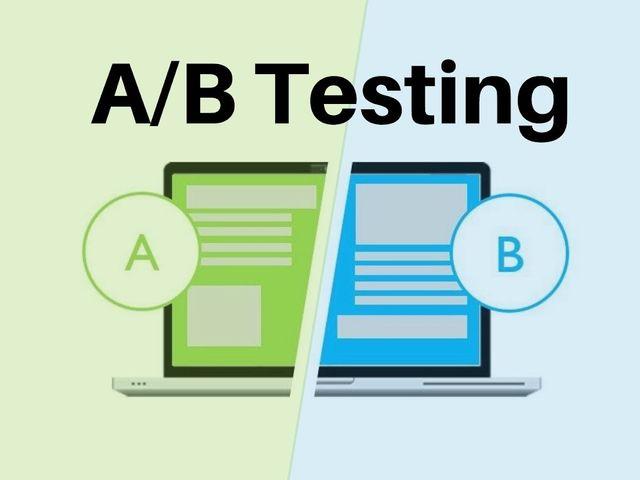
Statistical Test
A statistical test helps determine whether a random variable follows the null hypothesis or the alternate hypothesis. It essentially tells us if there are significant differences between samples and populations or among multiple samples. Descriptive statistics like mean, median, mode, range, or standard deviation can be used, but the mean is generally preferred.
The process involves:
Now you have an understanding of feature selection and statistical tests, we can move towards the implementation of various statistical tests along with their meaning.
Statistical tests come in a variety of forms, each designed to address a specific type of question. Some of the most common types of statistical tests include:
1. Z-Test
The Z-Test is like a detective that helps us figure out if two groups are really different or if any observed difference is just due to chance. Imagine you have two groups, let's call them Group A and Group B. You want to know if they are different from each other in some way.
Example:
Let's say you have the heights of students in Group A and Group B. The Z-Test can help you decide if the average height in Group A is significantly different from the average height in Group B.
In this example, the Z-Test helps you decide if the heights of students in Group A are significantly different from those in Group B. If the p-value is small, you might conclude that the groups have different average heights. If it's large, you might think any difference could just be due to chance.
2. T-Test
The T-Test is like a detective that helps us figure out if two groups are really different in some way. Imagine you have two groups, Group A and Group B. You want to know if they are different, but you have a smaller sample size.
Example:
Let's say you have the test scores of students in Group A and Group B. The T-Test can help you decide if the average test score in Group A is significantly different from the average test score in Group B.
T-Test helps you decide if the test scores of students in Group A are significantly different from those in Group B, taking into account the smaller sample size. If the p-value is small, you might conclude that the groups have different average test scores. If it's large, you might think any difference could just be due to chance.
3.ANOVA
ANOVA (Analysis of Variance) is like a detective that helps us when we have more than two groups. Imagine you're comparing test scores of students in three different classrooms: Class A, Class B, and Class C. You want to know if there's a real difference in their average scores.
Example
Let's say you have test scores from three classrooms. The ANOVA test can help you decide if there's a significant difference in the average test scores among these classrooms.
In this example, ANOVA helps you decide if there's a significant difference in the average test scores among the three classrooms. If the p-value is small, you might conclude that at least one classroom has a different average test score. If it's large, you might think the differences could be due to chance.
4.Chi-Square Test
The Chi-Square Test is like a detective investigating if there's a connection between two categorical variables. Imagine you're curious about the relationship between people's favourite genres of movies and their preferred streaming platforms.
Example:
Let's say you've surveyed people about their favorite movie genres (Action, Comedy, Drama) and their preferred streaming platform (Netflix, Hulu, Prime Video).
This Chi-Square Test helps you decide if there's a significant association between people's choices of movie genres and their preferred streaming platforms. If the p-value is small, you might conclude that there is a connection between these two categorical variables. If it's large, you might think the choices are independent.
Guidelines for Choosing Tests:
Choosing the right statistical test depends on the nature of your data and the specific research question or hypothesis you want to address. Here are some guidelines on when to use the mentioned statistical tests:
Comparing Means:
● Use T-Test for two groups with small sample sizes.
● Use Z-Test for two groups with large sample sizes and known population standard deviation.
● Use ANOVA for three or more groups.
Relationship Between Variables:
● Use Correlation for assessing linear relationships between two continuous variables.
● Use Chi-Square Test for assessing the association between two categorical variables.
Number of Groups:
● Use ANOVA for three or more independent groups.
● Use T-Test or Z-Test for two groups.
Data Types:
● Use T-Test, Z-Test, or ANOVA for continuous data.
● Use Chi-Square Test for categorical data.
Sample Size:
● If the sample size is small or the population standard deviation is unknown, the T-Test is preferred.
● If the sample size is large and the population standard deviation is known, the Z-Test is appropriate.
Conclusion
First, we have discussed feature selection. Then we moved to statistical tests and various terminologies related to it. Lastly, we have seen the application of statistical tests i.e, Z-test, T-test, correlation test, ANOVA test, and Chi-square along with their implementation in python.